Market Structure
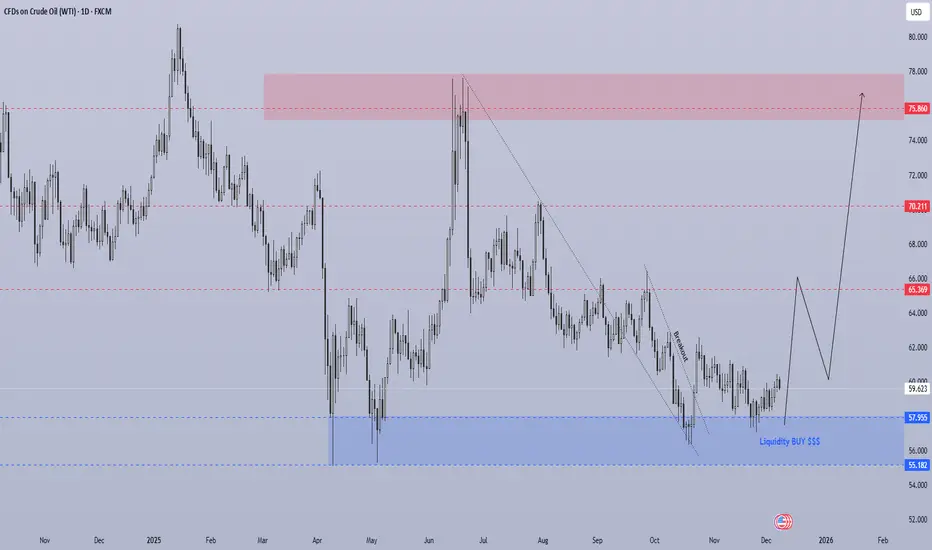
Oil has been in a long-term downtrend, but the chart now shows a clear break of the descending trendline, signaling a potential trend reversal.
Price reacted strongly from the blue liquidity zone (55.18 – 57.95) — a major demand area where institutions often buy.
This zone has now formed a double bottom / accumulation structure, indicating strong bullish interest.
2. Key Zones
🔵 Demand Zone (Liquidity BUY Area)
55.18 – 57.95
Multiple liquidity sweeps below 58.00.
Strong reversal candles confirmed buyers.
This is the base for the upcoming bullish leg.
🔴 First Major Resistance / Target
65.36
Previously strong support → now resistance.
Likely first stop for the new bullish trend.
🔴 Second Target Zone (Medium-term)
70.21
Previous major swing level.
A strong resistance zone where partial profits make sense.
🔴 Final High-Probability Target Zone (Premium Supply)
75.86 – 78.00
Large supply area.
Strong reaction expected here.
Best area for large players to sell again.
3. Price Action Outlook
Main Scenario – Bullish Reversal (High Probability)
Price has broken out of the descending structure.
A clean retest or shallow pullback is expected above 58–60 USD.
Strong bullish leg toward:
✔ TP1: 65.36
✔ TP2: 70.21
✔ TP3: 75.86 – 78.00 (Major target zone)
Why bullish?
Break of trendline = momentum shift.
Liquidity sweep at major demand zone.
Multiple rejection wicks show strong buyer control.
No bearish continuation structure forming.
✅FREE FOREX &CRYPTO SIGNALS TELEGRAM CHANNEL:
t.me/winlouhscalperchannel
t.me/winlouhscalperchannel
Penafian
Maklumat dan penerbitan adalah tidak bertujuan, dan tidak membentuk, nasihat atau cadangan kewangan, pelaburan, dagangan atau jenis lain yang diberikan atau disahkan oleh TradingView. Baca lebih dalam Terma Penggunaan.