There are 2 main types of markets categories from which derives the rest:
1. Centralized - A centralized market is structured in a way that allows all orders (purchase and sale) to be transferred to a central exchange, and to be transparent for traders.
2. Decentralized - Exactly the opposite of a centralized market. There is no main authority to deal with orders, instead, the orders from different institutions are connected to each other thru different. Market orders are not visible to traders.
Terms used:
- Aggressive market participants- any trader willing to buy or sell at market price, with instant order. - another name - liquidity consumer
- Passive market participants- any trader willing to buy or sell thru market limit pending orders. - another name - liquidity provider
Tick volume - Every time the price moves one tick up, it is counted as an up-tick, and every time the price is moving one thick down, it is counted as a down-tick.
Real volume - It is displayed in the order-book, and it is showing the pending sell and buy orders, together with market buy and sell orders. Every time the volume from a Buy market executed trade is matched with the volume of a pending sell order, it will be registered as Buy volume.
Note: The interaction between aggressive market participants and passive market participants, is what moves prices up or down. Every time the aggressive market participants are consuming the total liquidity at Bid or Ask, the price will move up or down, to the 0 liquidity level.
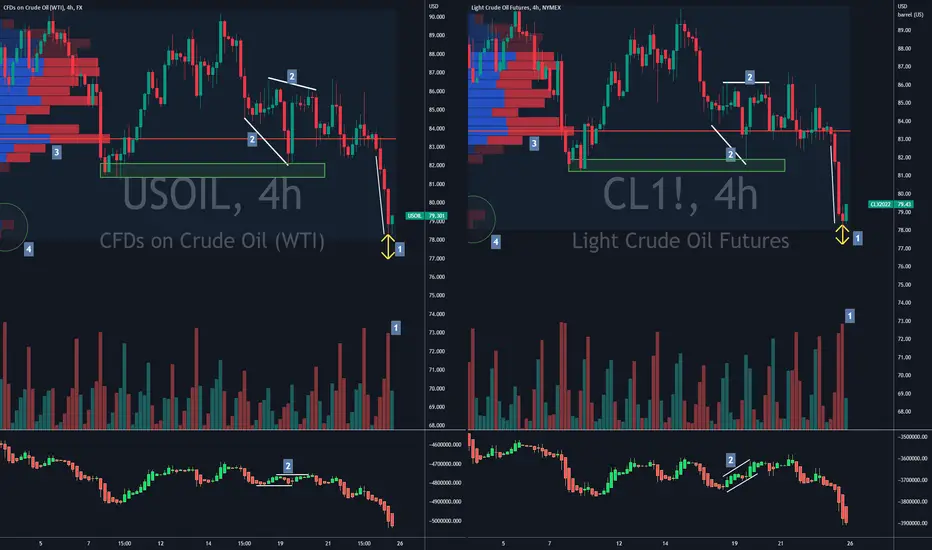
What you can see on the given charts.
Left - CFD on Crude Oil
Right - NYMEX Crude Oil Futures Contract (on my website I have a free course dedicated to explaining futures contracts)
I am trying to point out the difference that can appear in different volume trading indicators, but also on a candlestick. Of course, there are more, and you can play a little the - find the difference - game.
Point 1.
Bar volume - If the close price of a candle is less than the close price of the previous candle, then the volume bar of that candle will be red.
If the close price of a candle is higher/equal to the close price of the previous candle, then the volume bar of that candle will be green.
When the price broke under the 83.00 level, the last candle on CFD is larger than preview two, while on Futures, the last candle is the smallest. This is a significant difference because if you look at the volume bars down below, there is an increase in volume on a relatively small candle ( Futures ), which means that the aggressive sellers can not move the price lower, and might have hit a buy order wall, that will possibly create a support level at 78.00
Point 2.
Cumulative delta - It is displayed in form of candlesticks, and shows the difference between the Sell and Buy volume.
Sell volume - Buy Volume = Delta
In CFD chart delta is moving sideways, while in Futures, it is moving up. This difference is important, because an increased positive delta ( green bars ) means that are more aggressive buyers that are reacting at what seems to be a support level.
Point 3.
Volume Profile - First, it will create horizontal bars, showing the volume developed at certain price levels, or price segments, or price rows. Every time the price is going thru that defined price segment, the volume will be recorded for the time axis, and displayed on time periods like sessions, daily, weekly or monthly records of the volume passing thru the given segment.
If it is the case, the bar will display separately the buy and sell volume, or the difference between them, as delta.
The bar with the highest volume it is called Point Of Control, POC.
In the CFD chart, the uptick and downtick volume are almost similar, while on Futures, Sellers are more predominant. This is a good indication of the potential break direction. As in the given example, the price broke down, showing that the sellers at POC, had the power to push the price down.
Point 4.
When the price is heading for new levels, the new accumulated volume in the Volume Profile Indicator, can indicate a continuation or a stop in the price move. In the given example, on the left side you can see some uptick volume displayed in the bar, while in Futures, there is only sell volume. Considering that the last sell candle was with a big volume and short size, and that a new bull candle is forming, this is a signal that sometimes, the price will probably create a new support level at this price.
Don't Stumble Trading. Trade Safe
1. Centralized - A centralized market is structured in a way that allows all orders (purchase and sale) to be transferred to a central exchange, and to be transparent for traders.
2. Decentralized - Exactly the opposite of a centralized market. There is no main authority to deal with orders, instead, the orders from different institutions are connected to each other thru different. Market orders are not visible to traders.
Terms used:
- Aggressive market participants- any trader willing to buy or sell at market price, with instant order. - another name - liquidity consumer
- Passive market participants- any trader willing to buy or sell thru market limit pending orders. - another name - liquidity provider
Tick volume - Every time the price moves one tick up, it is counted as an up-tick, and every time the price is moving one thick down, it is counted as a down-tick.
Real volume - It is displayed in the order-book, and it is showing the pending sell and buy orders, together with market buy and sell orders. Every time the volume from a Buy market executed trade is matched with the volume of a pending sell order, it will be registered as Buy volume.
Note: The interaction between aggressive market participants and passive market participants, is what moves prices up or down. Every time the aggressive market participants are consuming the total liquidity at Bid or Ask, the price will move up or down, to the 0 liquidity level.
What you can see on the given charts.
Left - CFD on Crude Oil
Right - NYMEX Crude Oil Futures Contract (on my website I have a free course dedicated to explaining futures contracts)
I am trying to point out the difference that can appear in different volume trading indicators, but also on a candlestick. Of course, there are more, and you can play a little the - find the difference - game.
Point 1.
Bar volume - If the close price of a candle is less than the close price of the previous candle, then the volume bar of that candle will be red.
If the close price of a candle is higher/equal to the close price of the previous candle, then the volume bar of that candle will be green.
When the price broke under the 83.00 level, the last candle on CFD is larger than preview two, while on Futures, the last candle is the smallest. This is a significant difference because if you look at the volume bars down below, there is an increase in volume on a relatively small candle ( Futures ), which means that the aggressive sellers can not move the price lower, and might have hit a buy order wall, that will possibly create a support level at 78.00
Point 2.
Cumulative delta - It is displayed in form of candlesticks, and shows the difference between the Sell and Buy volume.
Sell volume - Buy Volume = Delta
In CFD chart delta is moving sideways, while in Futures, it is moving up. This difference is important, because an increased positive delta ( green bars ) means that are more aggressive buyers that are reacting at what seems to be a support level.
Point 3.
Volume Profile - First, it will create horizontal bars, showing the volume developed at certain price levels, or price segments, or price rows. Every time the price is going thru that defined price segment, the volume will be recorded for the time axis, and displayed on time periods like sessions, daily, weekly or monthly records of the volume passing thru the given segment.
If it is the case, the bar will display separately the buy and sell volume, or the difference between them, as delta.
The bar with the highest volume it is called Point Of Control, POC.
In the CFD chart, the uptick and downtick volume are almost similar, while on Futures, Sellers are more predominant. This is a good indication of the potential break direction. As in the given example, the price broke down, showing that the sellers at POC, had the power to push the price down.
Point 4.
When the price is heading for new levels, the new accumulated volume in the Volume Profile Indicator, can indicate a continuation or a stop in the price move. In the given example, on the left side you can see some uptick volume displayed in the bar, while in Futures, there is only sell volume. Considering that the last sell candle was with a big volume and short size, and that a new bull candle is forming, this is a signal that sometimes, the price will probably create a new support level at this price.
Don't Stumble Trading. Trade Safe
Penafian
Maklumat dan penerbitan adalah tidak dimaksudkan untuk menjadi, dan tidak membentuk, nasihat untuk kewangan, pelaburan, perdagangan dan jenis-jenis lain atau cadangan yang dibekalkan atau disahkan oleh TradingView. Baca dengan lebih lanjut di Terma Penggunaan.
Penafian
Maklumat dan penerbitan adalah tidak dimaksudkan untuk menjadi, dan tidak membentuk, nasihat untuk kewangan, pelaburan, perdagangan dan jenis-jenis lain atau cadangan yang dibekalkan atau disahkan oleh TradingView. Baca dengan lebih lanjut di Terma Penggunaan.