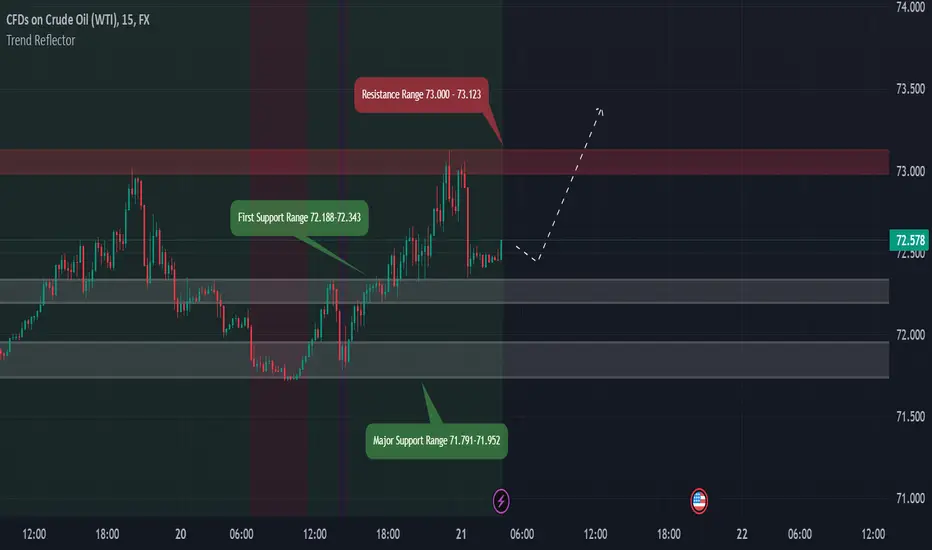
USOIL Chart analysis for Friday 21 Feb 25 Session 15M TF

USOIL last session closing was at 72.578 and made a high of 73.123 after studying it in higher TF i think if price comes downward then it's First Support Range is 72.188-72.343 if this range works as good support then we can see price upward movement from this range of support if it'll not sustain then Major Support Range is 71.791-71.952 it is good support it should sustain the price if it comes towards it in case it breaks then we can see bearish movement for the day , these support levels should work if we take a look in higher TF and our Trend Reflector also indicates bullish sentiment look for reversal price action if price comes to these levels , in case it breaks resistance zone of 73.000- 73.123 then we may get the level of 73.750 which is the next resistance , it's very clear look for bullish entry until major support breaks, it seems bullish for the day.
Nota
price comes down to major support zone we'll wait for price action at this zone if this support will sustain the market then we should go for buy look for good reversal signs before entering.Pesanan dibatalkan
price breaked major support zone goes opposite the direction i thought so not traded this instrument.Contact me on - t.me/at_Falcon
Penafian
Maklumat dan penerbitan adalah tidak bertujuan, dan tidak membentuk, nasihat atau cadangan kewangan, pelaburan, dagangan atau jenis lain yang diberikan atau disahkan oleh TradingView. Baca lebih dalam Terma Penggunaan.
Contact me on - t.me/at_Falcon
Penafian
Maklumat dan penerbitan adalah tidak bertujuan, dan tidak membentuk, nasihat atau cadangan kewangan, pelaburan, dagangan atau jenis lain yang diberikan atau disahkan oleh TradingView. Baca lebih dalam Terma Penggunaan.