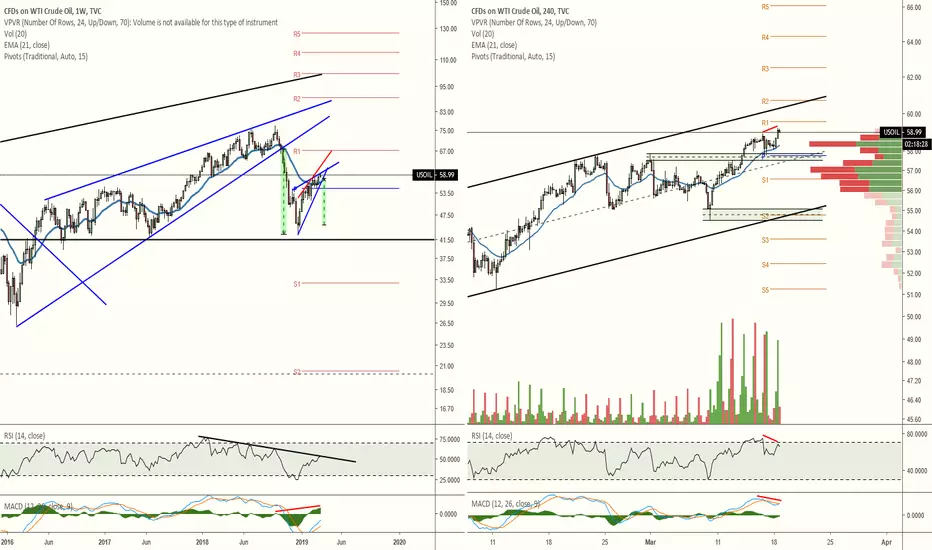
Weekly chart shows price nearing the apex of the ascending wedge with a target of $45. RSI is hitting resistance and MACD's histogram is possibly printing hidden bearish divergence.
H4 chart shows RSI, and possibly MACD, printing bearish divergence. The nearby demand has already been tapped once making it much easier for the next drop into it to potentially fall further. I would watch for the demand below that at around $55 to provide some support. It also aligns with the ascending channel's support. If that support cannot hold then, based on the height of the ascending channel, we should be looking at $49.70/$50 for the next likely support. That target is a mere $5 away from the weekly breakdown target.
H4 chart shows RSI, and possibly MACD, printing bearish divergence. The nearby demand has already been tapped once making it much easier for the next drop into it to potentially fall further. I would watch for the demand below that at around $55 to provide some support. It also aligns with the ascending channel's support. If that support cannot hold then, based on the height of the ascending channel, we should be looking at $49.70/$50 for the next likely support. That target is a mere $5 away from the weekly breakdown target.
Penafian
Maklumat dan penerbitan adalah tidak dimaksudkan untuk menjadi, dan tidak membentuk, nasihat untuk kewangan, pelaburan, perdagangan dan jenis-jenis lain atau cadangan yang dibekalkan atau disahkan oleh TradingView. Baca dengan lebih lanjut di Terma Penggunaan.
Penafian
Maklumat dan penerbitan adalah tidak dimaksudkan untuk menjadi, dan tidak membentuk, nasihat untuk kewangan, pelaburan, perdagangan dan jenis-jenis lain atau cadangan yang dibekalkan atau disahkan oleh TradingView. Baca dengan lebih lanjut di Terma Penggunaan.
