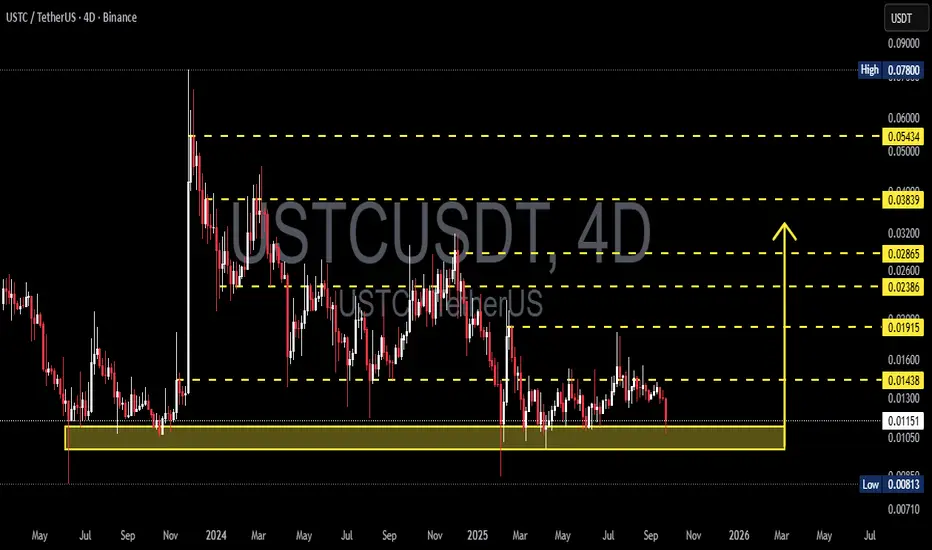
USTC is once again trading at a crucial demand zone (0.0105 – 0.0115 USDT) on the 4D chart (Binance). This area has repeatedly acted as a strong support since 2024, absorbing heavy selling pressure and triggering notable rebounds.
This zone is not just a normal support — it’s an accumulation area that has historically sparked strong bounces. Long downside wicks confirm liquidity sweeps, followed by quick recoveries, signaling active demand around this region.
---
🔎 Structure & Pattern
1. Range / Sideways Accumulation
Price is moving within a wide range between this demand zone and layered resistances above, showing mid-term accumulation before a bigger move.
2. Lower Highs after Spikes
Each strong rally has failed to break above major resistance, forming lower highs and signaling persistent supply pressure.
3. Liquidity Sweeps
Multiple fake breaks below support (long wicks) indicate liquidity grabs, where stop losses are triggered before price returns inside the range.
---
🚀 Bullish Scenario
If the 0.0105 – 0.0115 support zone holds:
Confirmation comes from a bullish rejection candle (pin bar / engulfing) on the 4D timeframe.
Upside targets:
🎯 0.01438 (nearest resistance)
🎯 0.01915 (mid resistance)
🎯 0.02386 – 0.02865 if momentum expands further
Logic: Repeated defense of this zone suggests accumulation, with potential for short covering and fresh buying that can drive price back into mid-range resistances.
---
⚠️ Bearish Scenario
If 0.0105 breaks on a 4D close:
Breakdown would confirm weakness → likely downside to 0.00813 (historical low).
A move below this level may open the door for deeper bearish continuation.
Logic: Many stops are placed below this zone. A breakdown with strong volume could trigger panic selling and accelerate bearish pressure.
---
📌 Key Levels
Main Support: 0.0105 – 0.0115
Layered Resistances: 0.01438 → 0.01915 → 0.02386 → 0.02865 → 0.03839 → 0.05434
---
🎯 Conclusion
USTC is standing at a decision point:
Holding above 0.0105–0.0115 may trigger a rebound toward 0.01438 and 0.01915 with attractive risk-to-reward potential.
A confirmed breakdown below 0.0105 opens room toward 0.00813 and possibly lower.
Wait for a clear 4D close and volume confirmation before committing to either side.
---
#USTC #USTCUSDT #CryptoAnalysis #Altcoins #SupportResistance #ChartPattern #TechnicalAnalysis #CryptoUpdate #BullishOrBearish
✅ Get Free Signals! Join Our Telegram Channel Here: t.me/TheCryptoNuclear
✅ Twitter: twitter.com/crypto_nuclear
✅ Join Bybit : partner.bybit.com/b/nuclearvip
✅ Benefits : Lifetime Trading Fee Discount -50%
✅ Twitter: twitter.com/crypto_nuclear
✅ Join Bybit : partner.bybit.com/b/nuclearvip
✅ Benefits : Lifetime Trading Fee Discount -50%
Penafian
Maklumat dan penerbitan adalah tidak dimaksudkan untuk menjadi, dan tidak membentuk, nasihat untuk kewangan, pelaburan, perdagangan dan jenis-jenis lain atau cadangan yang dibekalkan atau disahkan oleh TradingView. Baca dengan lebih lanjut di Terma Penggunaan.