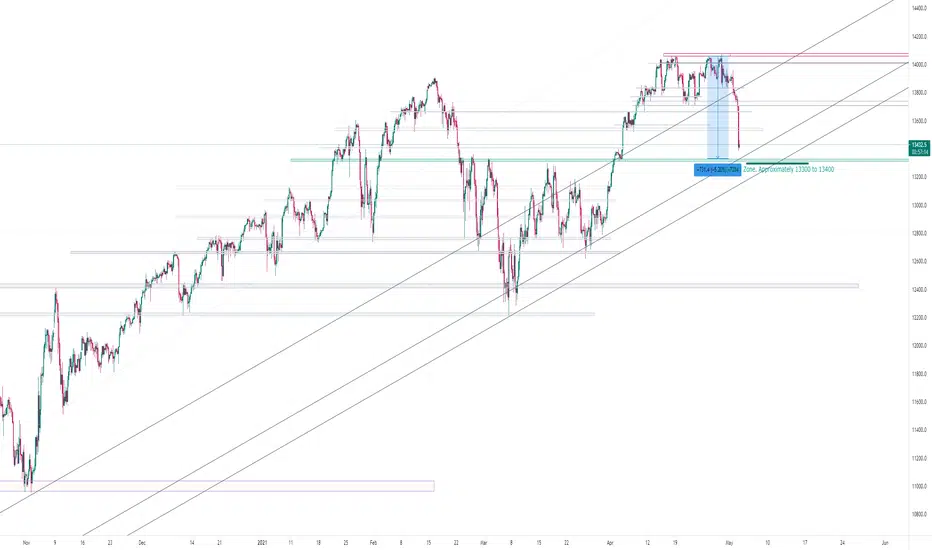
Tech 100 index dropped approximately 4.5% from its recent ATH. This presents us with an attractive opportunity to go long from here. Technical indicators on the daily chart show that the price is now at its 50 EMA. Its a great pullback to buy from. Further downside is limited while the upside is substantial. How about Sell in May and Go Away? Well last 10 years show that statistically only 50% of the years have had a drop in may, so in reality other factors will drive the Tech100 index and it's constituents.
I am starting to accumulate here for the next high. Target 15,000. Are you?
I am starting to accumulate here for the next high. Target 15,000. Are you?
Penerbitan berkaitan
Penafian
Maklumat dan penerbitan adalah tidak dimaksudkan untuk menjadi, dan tidak membentuk, nasihat untuk kewangan, pelaburan, perdagangan dan jenis-jenis lain atau cadangan yang dibekalkan atau disahkan oleh TradingView. Baca dengan lebih lanjut di Terma Penggunaan.
Penerbitan berkaitan
Penafian
Maklumat dan penerbitan adalah tidak dimaksudkan untuk menjadi, dan tidak membentuk, nasihat untuk kewangan, pelaburan, perdagangan dan jenis-jenis lain atau cadangan yang dibekalkan atau disahkan oleh TradingView. Baca dengan lebih lanjut di Terma Penggunaan.