📍 Live price context
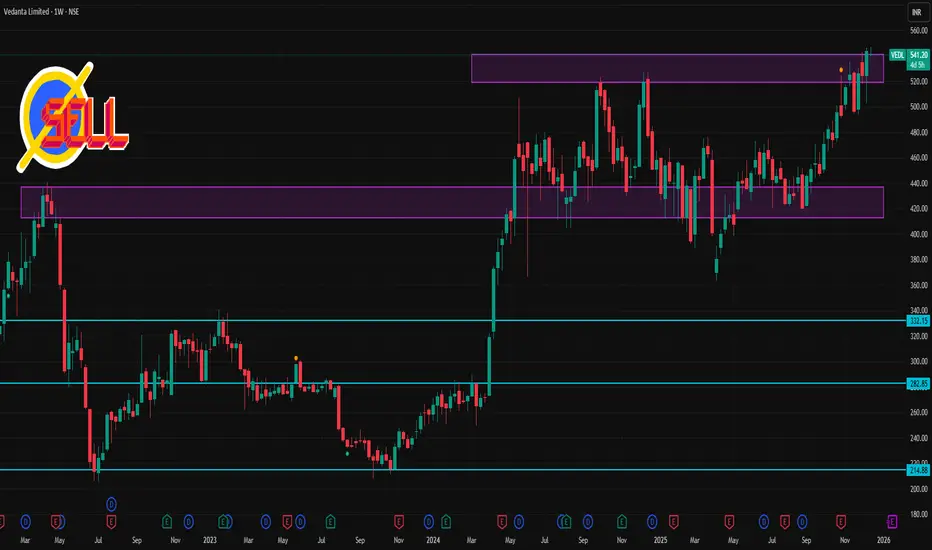
Vedanta is trading around ₹540 + on NSE.
📊 Weekly (1‑Week Timeframe) Key Levels
🧱 Resistance Levels (Upside)
These are levels where price may face selling pressure / struggle to break above:
R1: ~₹548 – ₹553 — short‑term technical resistance zone.
R2: ~₹555 – ₹560 — broader upside/wider resistance (weekly chart often reflects overhead supply near recent highs).
R3: ~₹565 + — psychological/upper projection zone if momentum continues.
📉 Support Levels (Downside)
Key floors where price may find buying interest / bounce:
S1: ~₹536 – ₹538 — immediate weekly support near pivot area.
S2: ~₹530 – ₹532 — next support cluster on weekly pivot levels.
S3: ~₹525 – ₹526 — deeper weekly support if price corrects further.
Penerbitan berkaitan
Penafian
Maklumat dan penerbitan adalah tidak bertujuan, dan tidak membentuk, nasihat atau cadangan kewangan, pelaburan, dagangan atau jenis lain yang diberikan atau disahkan oleh TradingView. Baca lebih dalam Terma Penggunaan.
Penerbitan berkaitan
Penafian
Maklumat dan penerbitan adalah tidak bertujuan, dan tidak membentuk, nasihat atau cadangan kewangan, pelaburan, dagangan atau jenis lain yang diberikan atau disahkan oleh TradingView. Baca lebih dalam Terma Penggunaan.