🔎 Overview
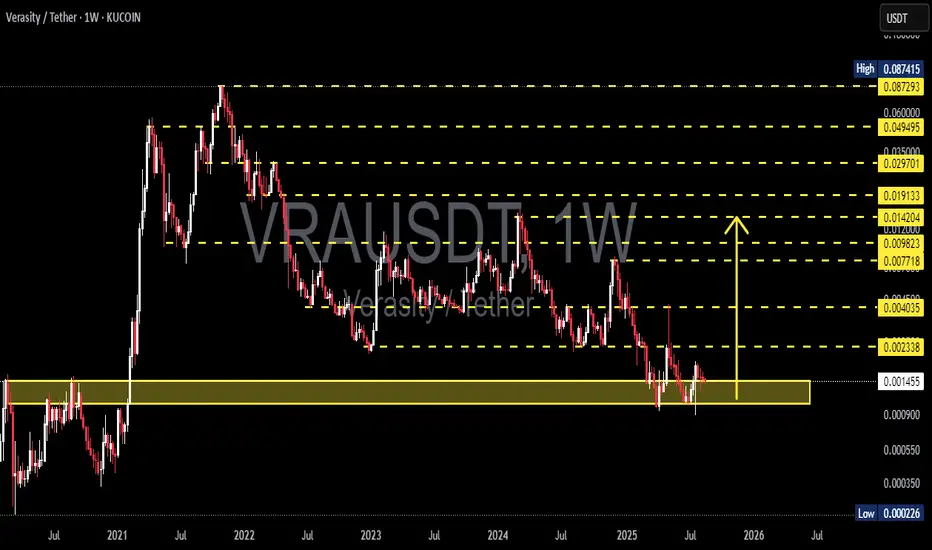
Verasity (VRA) has been in a long-term downtrend since the 2021 peak, forming consistent lower highs and lower lows. Right now, price is retesting a major historical demand zone around 0.0009 – 0.0017, an area that previously acted as a strong foundation for major rallies back in 2020–2021.
This is not just a number range, but a decision point:
👉 Will VRA confirm accumulation and reversal?
👉 Or will it break down below support and revisit historical lows?
---
📌 Key Levels (from chart)
Current price: 0.001456
Major Demand Zone (support): 0.0009 – 0.0017
Resistance levels (step-by-step):
0.002338 → 0.004035 → 0.007718 → 0.009823 → 0.014204 → 0.019133
Long-term targets: 0.029701 → 0.049495 → 0.060000 → 0.087415
Extreme historical low: 0.000226
---
📉 Structure & Pattern
Primary trend: Bearish since 2021.
Current structure: Sideways consolidation inside demand zone. Multiple long lower wicks suggest buying interest at lower levels.
Potential patterns:
Holding above 0.0009 with a higher low could evolve into an accumulation base (early stage reversal).
Failure to hold = possible continuation of downtrend toward new lows.
---
🚀 Bullish Scenario
Confirmation: Weekly close above 0.002338 with strong volume.
Upside targets:
TP1: 0.004035
TP2: 0.007718
TP3: 0.014204
TP4: 0.019133 (major supply area)
Extended targets: If the broader crypto market supports, VRA could potentially revisit 0.029–0.06 in the long term.
Strategy:
Aggressive: Scale-in within 0.0010–0.0016 demand zone, Stop Loss below 0.00085.
Conservative: Wait for breakout above 0.002338 before entering.
---
⚠️ Bearish Scenario
Confirmation: Weekly close below 0.0009 with strong selling pressure.
Downside targets:
0.0005 (psychological level)
0.000226 (historical capitulation low)
Implication: A breakdown would extend the bear cycle and delay recovery significantly.
---
📚 Extra Insights
This demand zone is essentially VRA’s “last stand” before retesting the all-time lows.
Market context matters: VRA’s ability to recover strongly depends on BTC trend and altcoin season strength.
Volume is key: Breakouts without volume are often fake; watch for strong confirmation.
---
📝 Conclusion
VRA is at a make-or-break point:
Bullish case: Hold demand zone + breakout above 0.002338 = potential multi-stage rally.
Bearish case: Breakdown below 0.0009 = opens path to 0.0005 → 0.000226.
📌 Short-term traders should watch 0.002338 as the breakout trigger.
📌 Long-term investors may see this zone as an accumulation opportunity — but risk management with strict stops is essential.
#VRAUSDT #Verasity #Crypto #AltcoinAnalysis #CryptoTrading #SupportResistance #TechnicalAnalysis #WeeklyChart #SupplyDemand
✅ Get Free Signals! Join Our Telegram Channel Here: t.me/TheCryptoNuclear
✅ Twitter: twitter.com/crypto_nuclear
✅ Join Bybit : partner.bybit.com/b/nuclearvip
✅ Benefits : Lifetime Trading Fee Discount -50%
✅ Twitter: twitter.com/crypto_nuclear
✅ Join Bybit : partner.bybit.com/b/nuclearvip
✅ Benefits : Lifetime Trading Fee Discount -50%
Penafian
Maklumat dan penerbitan adalah tidak bertujuan, dan tidak membentuk, nasihat atau cadangan kewangan, pelaburan, dagangan atau jenis lain yang diberikan atau disahkan oleh TradingView. Baca lebih dalam Terma Penggunaan.