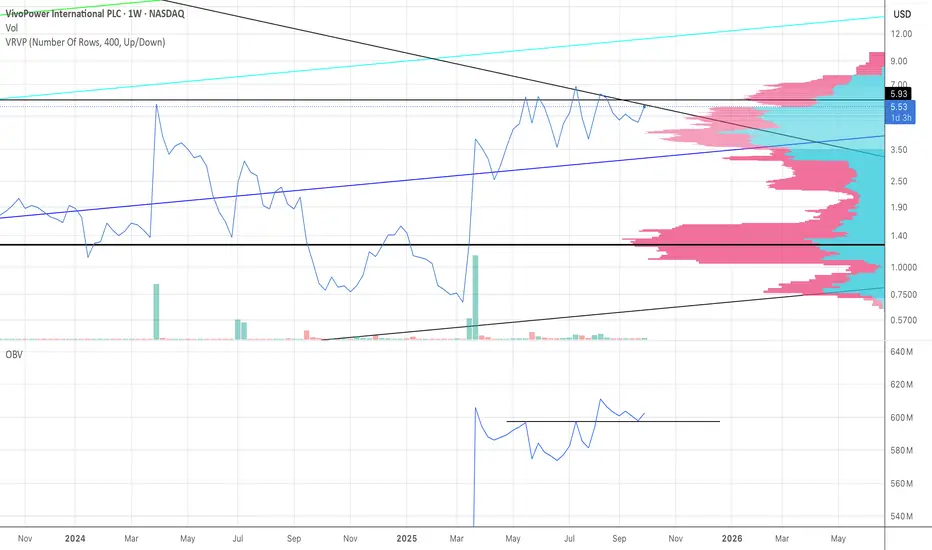
Here, we have the price (in line) smashing up against a descending overhead from early in the chart. Also, we're at the upper edges of the Volume Profile. Even though I don't have the whole chart history on the page, it doesn't matter because I have the part that has the volume, as you can see in that first green candle. That's when the chart "came to life". So, since volume has entered the ticker, we're at the upper edges of the price and the volume profile. A break out from here will be catastrophic for the bears, because the move will be larger than most anticipate.
Penafian
Maklumat dan penerbitan adalah tidak bertujuan, dan tidak membentuk, nasihat atau cadangan kewangan, pelaburan, dagangan atau jenis lain yang diberikan atau disahkan oleh TradingView. Baca lebih dalam Terma Penggunaan.
Penafian
Maklumat dan penerbitan adalah tidak bertujuan, dan tidak membentuk, nasihat atau cadangan kewangan, pelaburan, dagangan atau jenis lain yang diberikan atau disahkan oleh TradingView. Baca lebih dalam Terma Penggunaan.