Waves Corporation Ltd (PSX: WAVES) – Weekly Chart Breakout
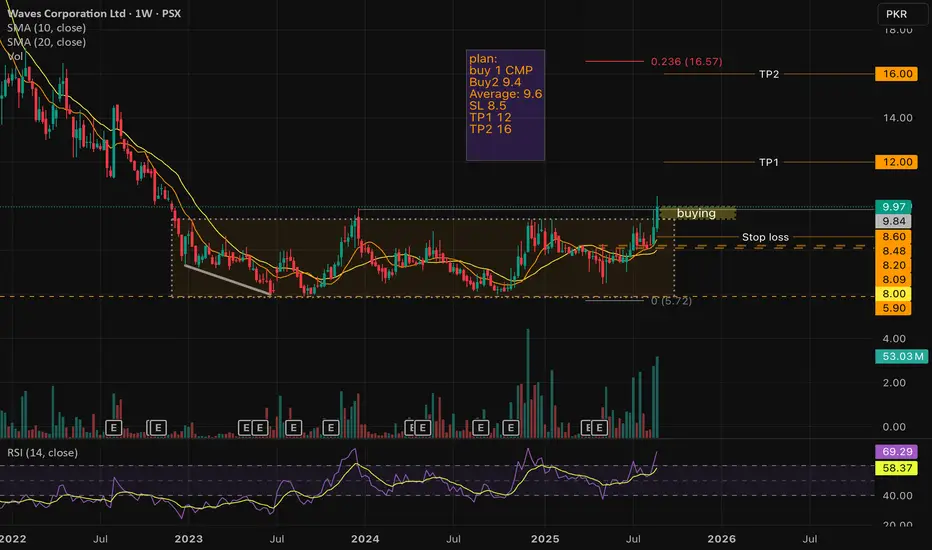
Waves has finally broken out of a long consolidation zone with strong volume confirmation. Price closed at 9.97 (+10.29%), above both the 10 SMA (8.48) and 20 SMA (8.00).
📌 Trading Plan:
Buy 1: CMP
Buy 2: 9.4
Avg Entry: 9.6
Stop Loss: 8.5
TP1: 12
TP2: 16
📊 Observations:
RSI at 69.29, approaching overbought but still room to run.
Weekly breakout after 2+ years of sideways action.
Strong volume spike supports bullish momentum.
⚠️ Risk management is key: Protect with SL below 8.5.
Dagangan aktif
TP1 hit Trail your SL at breakeven and ride for TP2
Penafian
Maklumat dan penerbitan adalah tidak bertujuan, dan tidak membentuk, nasihat atau cadangan kewangan, pelaburan, dagangan atau jenis lain yang diberikan atau disahkan oleh TradingView. Baca lebih dalam Terma Penggunaan.
Penafian
Maklumat dan penerbitan adalah tidak bertujuan, dan tidak membentuk, nasihat atau cadangan kewangan, pelaburan, dagangan atau jenis lain yang diberikan atau disahkan oleh TradingView. Baca lebih dalam Terma Penggunaan.