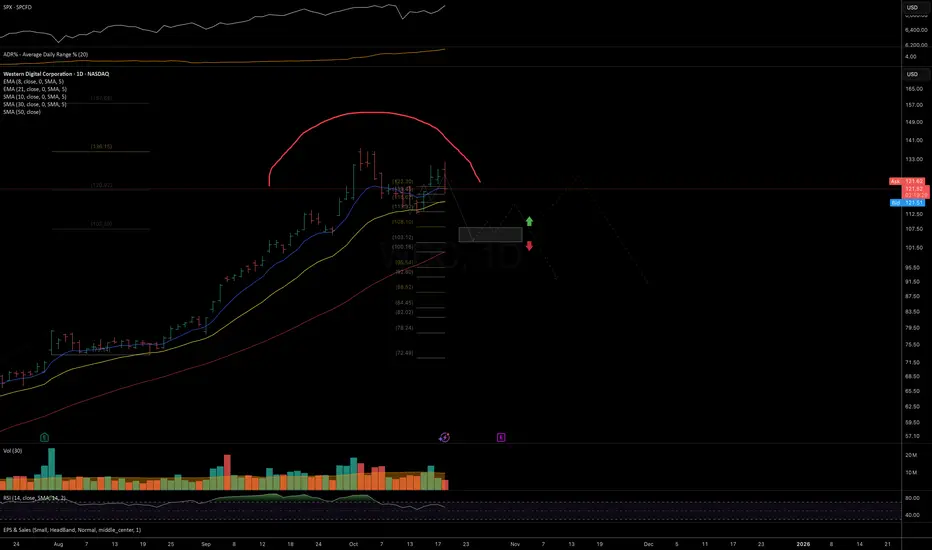
Price continues to act in line with the trend structure suggested in the October analysis. As long as price remains below today’s low, I’m watching for downside continuation toward the 108–103 support zone in the short term, with potentially lower targets in the mid-term.
Chart:
Previously:
On downside potential (Oct 9):
Chart:
see in weekly review: https://www.tradingview.com/chart/BITF/MXF8r9gK-Weekly-Chart-Review-Oct-6-10-2025/
Chart:
Previously:
On downside potential (Oct 9):
Chart:
see in weekly review: https://www.tradingview.com/chart/BITF/MXF8r9gK-Weekly-Chart-Review-Oct-6-10-2025/
Nota
Chart:
📊 Daily FREE Market Insights | Crypto + US Stocks
⚡ Technical analysis, setups & commentary
🌍 t.me/MarketArtistryENG | 🇷🇺 t.me/marketartistry
⚡ Technical analysis, setups & commentary
🌍 t.me/MarketArtistryENG | 🇷🇺 t.me/marketartistry
Penerbitan berkaitan
Penafian
Maklumat dan penerbitan adalah tidak bertujuan, dan tidak membentuk, nasihat atau cadangan kewangan, pelaburan, dagangan atau jenis lain yang diberikan atau disahkan oleh TradingView. Baca lebih dalam Terma Penggunaan.