WIPRO LTD.
Wave Structure:
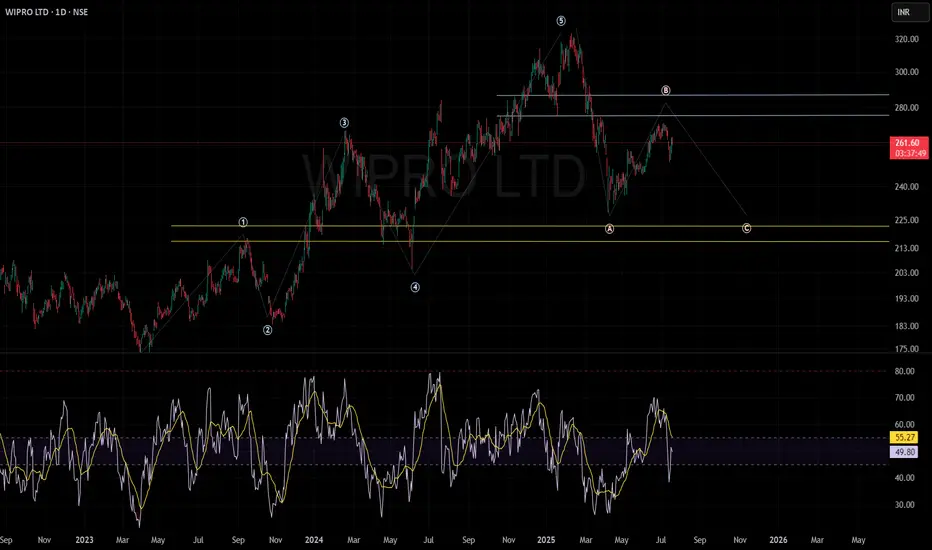
The chart depicts a well-defined Elliott Wave pattern, illustrating a completed five-wave impulse sequence succeeded by a classic ABC corrective phase.
Wave B retracement appears to be underway, with resistance anticipated around the ₹275–₹285 zone.
Support & Resistance:
Key resistance levels are established at ₹275–₹285, which historically coincided with selling pressure and reversal zones.
Major support zones are highlighted between ₹210–₹225, a region with repeated buying interest and robust price recovery in the past.
Technical Outlook:
The current price structure suggests continued corrective bias, with a probable move towards the lower support band (₹210–₹225), barring any decisive reversal above the key resistance.
Unless momentum breaks out above ₹285 with conviction, the base scenario remains cautious to bearish.
My analysis is anchored in classical price action and Elliott Wave theory to identify potential market inflection points.
Sentiment:
The prevailing market sentiment remains neutral to negative as the price fails to breach significant resistance and is trading below the Wave B peak.
A shift in momentum can only be confirmed if there is sustained price action above resistance with increased volume.
Disclaimer:
This analysis is strictly for educational and informational purposes, not intended as trading or investment advice.
Wave Structure:
The chart depicts a well-defined Elliott Wave pattern, illustrating a completed five-wave impulse sequence succeeded by a classic ABC corrective phase.
Wave B retracement appears to be underway, with resistance anticipated around the ₹275–₹285 zone.
Support & Resistance:
Key resistance levels are established at ₹275–₹285, which historically coincided with selling pressure and reversal zones.
Major support zones are highlighted between ₹210–₹225, a region with repeated buying interest and robust price recovery in the past.
Technical Outlook:
The current price structure suggests continued corrective bias, with a probable move towards the lower support band (₹210–₹225), barring any decisive reversal above the key resistance.
Unless momentum breaks out above ₹285 with conviction, the base scenario remains cautious to bearish.
My analysis is anchored in classical price action and Elliott Wave theory to identify potential market inflection points.
Sentiment:
The prevailing market sentiment remains neutral to negative as the price fails to breach significant resistance and is trading below the Wave B peak.
A shift in momentum can only be confirmed if there is sustained price action above resistance with increased volume.
Disclaimer:
This analysis is strictly for educational and informational purposes, not intended as trading or investment advice.
Penafian
Maklumat dan penerbitan adalah tidak bertujuan, dan tidak membentuk, nasihat atau cadangan kewangan, pelaburan, dagangan atau jenis lain yang diberikan atau disahkan oleh TradingView. Baca lebih dalam Terma Penggunaan.
Penafian
Maklumat dan penerbitan adalah tidak bertujuan, dan tidak membentuk, nasihat atau cadangan kewangan, pelaburan, dagangan atau jenis lain yang diberikan atau disahkan oleh TradingView. Baca lebih dalam Terma Penggunaan.