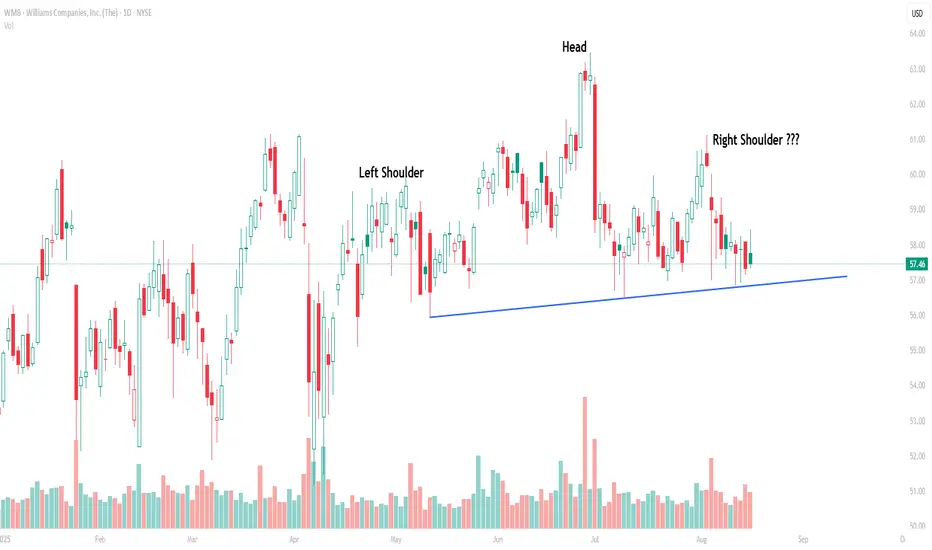
Key Note: Let’s keep it straight — until the neckline breaks, this remains a potential Head
& Shoulders (H&S), not a confirmed one. A close below $56.5 on strong volume would
be the real confirmation trigger.
Currently, WMB is sketching what looks like a bearish Head & Shoulders pattern. The
left shoulder was formed in April near $60, the head at the June peak around $63 and the
right shoulder is emerging with the recent rally stalling back at $60. The neckline aligns
with the rising trendline support around $57, which has been repeatedly tested.
If the neckline gives way, the breakdown completes the bearish setup, with a measured
downside projection of roughly $50, based on the head-to-neckline height. Until then,
this remains just a developing structure rather than a done deal.
Penafian
The information and publications are not meant to be, and do not constitute, financial, investment, trading, or other types of advice or recommendations supplied or endorsed by TradingView. Read more in the Terms of Use.
Penafian
The information and publications are not meant to be, and do not constitute, financial, investment, trading, or other types of advice or recommendations supplied or endorsed by TradingView. Read more in the Terms of Use.