Bonjour,
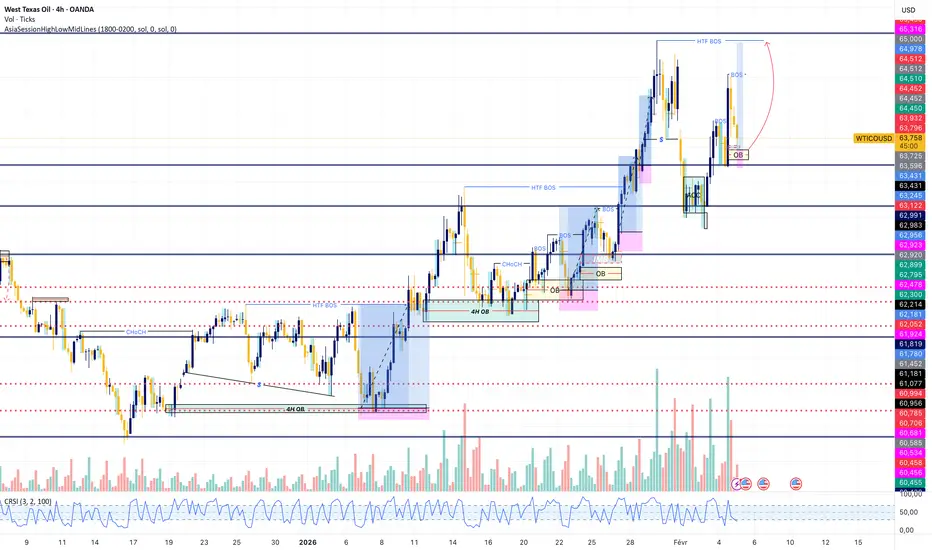
Comme vous voyez sur le graph nous sommes sur une tendance haussière sur 4H, le prix bien de combler le gap baissier que le prix à laisser après un retest sur la golden zone Fibo (61,600).
Sur LTF, après que le prix nous a comblé le gap il viens de re-tester sur la zone de (63,400/63,000) pour prendre le max de liquidités possible pour voir les 68$ directement.
Hello,
As you can see on the chart, we’re currently in a bullish trend on the 4H timeframe. The price just filled the bearish gap that was left after retesting the golden Fibonacci zone (61.600).
On the lower timeframes, after filling the gap, the price came back to retest the (63.400/63.000) area to grab as much liquidity as possible before targeting the $68 level.
Penafian
Maklumat dan penerbitan adalah tidak bertujuan, dan tidak membentuk, nasihat atau cadangan kewangan, pelaburan, dagangan atau jenis lain yang diberikan atau disahkan oleh TradingView. Baca lebih dalam Terma Penggunaan.
Penafian
Maklumat dan penerbitan adalah tidak bertujuan, dan tidak membentuk, nasihat atau cadangan kewangan, pelaburan, dagangan atau jenis lain yang diberikan atau disahkan oleh TradingView. Baca lebih dalam Terma Penggunaan.