### Catchy Caption: "Godshield Icon’s Gold Rush: A Week of Wins, Lessons, and Market Mastery on XAU/USD!"
Hey fam, let’s dive into my wild week in the gold market, from Sunday, April 20, 2025, to today, Friday, April 25, 2025. I’ve been hunting on the XAU/USD charts, balancing my love for trading with my other passions, and I’m here to break it all down for you—my strengths, my slip-ups, and everything in between. Grab a smoothie from Tastequest.com, spritz on some Icoca from Icon Collections Store, and let’s talk gold!
My Week in the Gold Market
Sunday, April 20, 2025: I kicked off the week with a deep dive into the XAU/USD 4-hour chart. Gold was sitting pretty around $3,400, still buzzing from the record high of $3,499.88 earlier in the week on April 22, as reported by LiteFinance. I spotted a potential pullback after the Shanghai Gold Exchange hit its 8th consecutive high, per BullionVault, and decided to wait for confirmation. My plan was to catch a dip using my harmonic patterns—something I’ve been mastering since my early trading days in 2020. I didn’t enter any trades yet, just stalked the market like a predator.
Monday, April 21, 2025:* Gold topped $3,400 after Trump’s comments on Fed Chair Powell sent the US dollar sliding, according to BullionVault. I saw an opportunity on the M30 chart and jumped in with a buy trade at $3,410, aiming for a quick 50-pip scalp—similar to my scalping strategies back in March when I targeted 20 pips on a 15-minute chart. I used my go-to tools: Heikin Ashi for trend confirmation and order blocks to pinpoint smart money zones. My entry was spot-on, and I closed the trade at $3,415, pocketing a solid win. But the market was volatile—gold later pulled back below $3,300 by the end of the day, a 2.3% drop from its peak, which had me second-guessing if I should’ve held longer.
Tuesday, April 22, 2025:
Gold hit that all-time high of $3,499.88, and I was hyped! I analyzed the 1-hour chart, spotting a Bullish Bat pattern forming, a setup I’ve been refining since my harmonic pattern deep dives. I entered a buy at $3,480, setting a tight stop-loss at $3,470 and a take-profit at $3,500, aiming for a 1:2 risk-reward ratio. The trade played out perfectly, hitting my target mid-day. But I missed a bigger move—gold futures later dropped to $3,300 by April 24, per Investopedia, and I could’ve flipped to a sell if I’d paid closer attention to the RSI showing overbought conditions, as noted by LiteFinance.
Wednesday, April 23, 2025:
The market got a breather as Trump softened his stance on tariffs, per Investopedia, and gold settled around $3,300. I decided to test a sell trade on the M30 chart after spotting a bearish shark pattern—part of the setup I shared in my follower note today. I entered at $3,310, with a stop-loss at $3,320 and a take-profit at $3,290, targeting the lower trendline of my descending channel. The trade hit my take-profit, but I noticed I was late on my entry; the neckline retest on the 15-minute chart had already happened, and I could’ve gotten in at $3,315 for a better risk-reward. My impatience cost me a few pips.
Thursday, April 24, 2025:
Gold was at $3,300, and I took a step back to analyze the bigger picture. The market was choppy after a 3.5% drop in gold futures, as Investopedia mentioned, and I didn’t want to get whipsawed. I focused on backtesting my strategy instead, refining my checklist with MACD and RSI for momentum—something I’ve been working on for six months. I also prepped my follower note, detailing the bearish three drives and head and shoulders patterns I’d been tracking, which played out today. No trades, but I felt sharp and ready.
Friday, April 25, 2025 (Today):
Gold’s at $3,293.92, according to LiteFinance, and I’m wrapping up the week with my follower note on XAU/USD M30. I didn’t trade today—markets like MCX were closed for Good Friday earlier this week, and I’ve been cautious after Monday’s volatility. Instead, I shared my analysis: a bearish shark confirming the downtrend, with supply at the right shoulder of the head and shoulders and demand near the lower trendline. I’m still looking for two people to join me at Academia for Forex Trading—hit me up if you’re ready to hunt!
My Strengths
- Pattern Recognition: I’m a beast at spotting harmonic patterns like the Bullish Bat and Bearish Shark. My Tuesday buy trade at $3,480 was a textbook example of how I use Fibonacci ratios and market structure to nail entries.
- Discipline: I stuck to my checklist this week—waiting for Heikin Ashi confirmation and order blocks before jumping in. My Wednesday sell trade at $3,310 showed how I align every piece before striking.
- Adaptability: I’ve been trading gold since 2020, and I’ve learned to pivot fast. Monday’s quick scalp at $3,410 and my decision to sit out Thursday’s choppy market show I can read the market’s mood and act accordingly.
Areas of Weakness
- Overthinking Momentum: I missed a bigger move on Tuesday because I didn’t trust the RSI’s overbought signal. LiteFinance noted the bearish divergence, and I should’ve flipped to a sell sooner instead of chasing the uptrend.
- Timing Entries: Wednesday’s sell at $3,310 was late—I could’ve entered at $3,315 if I’d been more patient for the neckline retest. I need to work on timing my entries better, especially in volatile markets.
- Emotional Balance: My mother’s concern about my losses (like she mentioned today) got in my head mid-week. I stayed disciplined, but I need to better separate emotions from trading, especially after a string of stop-loss hits.
Vibe Check
So, what do you think, fam? Should I have gone for that sell on Tuesday, or was I right to lock in my profits? Drop your thoughts below—I’m curious to hear how you’d play this week’s XAU/USD moves! And if you’re one of the two ready to join me at Academia, let’s talk. We’ll hunt these markets together, using the same checklist that’s got me rating my system a ten out of ten. Oh, and while you’re at it, check out Icon Collections Store—grab a 6ml sample of RiverSide, Desire, or Icoca, and let me know which scent vibes with your trading energy!
Note for My Followers - April 25, 2025
Memo: Godshield Icon
I’m dropping this XAU/USD M30 insight because my system’s a damn executioner, and you need to see how I hunt the market. This chart is a textbook of bearish patterns—first a bearish three drives showing smart money exhausting buyers with three weakening upward pushes, then a head and shoulders with the neckline break confirming the reversal, and now a bearish shark forming to seal the deal, all playing out within my descending trendlines. Smart money’s been in control from the start, distributing at the peaks, grabbing liquidity, and dumping price to hunt stop-losses below key levels. Supply and demand zones are my edge—supply at the right shoulder of the head and shoulders where sellers stacked orders before the break, demand near the lower trendline where buyers might step in, my target for this bearish move. My checklist operations are a predator’s playbook. I start with harmonic patterns, hunting XABCD structures like the bearish shark I’m seeing now, signaling smart money’s reversal zones. I confirm market structure, looking for breaks of structure to show trend shifts—here, the neckline break confirms bearish continuation. I identify order blocks, those consolidation zones where smart money stacks orders, like the bearish order block at the right shoulder where sellers distributed. Volume profile is key—I check for high volume nodes where price stalls, like the neckline where sellers defended, and low volume nodes that act as magnets, like gaps below the neckline. Top-down analysis keeps me sharp—four-hour timeframe sets the bearish trend, one-hour confirms the break, thirty-minute narrows the setup, fifteen-minute is my strike zone, waiting for a neckline retest. I use Heikin Ashi for confirmation—red candles mean sell, waiting for red on the fifteen-minute at the retest. Fibonacci levels mark my targets—I focus on key extensions to set exits, like targeting the lower trendline of the channel. Gann theory adds confluence—I look for angles or retracements to align with my setups, like a Gann angle pointing to the lower trendline. MACD and RSI measure momentum—MACD’s bearish crossover and negative histogram confirm the downtrend, RSI below fifty with bearish divergence at the right shoulder seals it. Risk management is my law—I risk small to win big, stop-loss above the right shoulder, take-profit at the lower trendline, aiming for a high reward ratio. I monitor news and liquidity traps—fake spikes above the neckline are smart money’s tricks, so I stay sharp. I wait for confirmation—every piece aligns, or I walk, then I document to keep my edge razor-sharp. I’m rating this system a ten out of ten—harmonic patterns, Smart Money Concepts, volume profile, top-down analysis, and now MACD and RSI for momentum make it untouchable. I’ve fine-tuned this over six months, backtesting until it’s a weapon. I need two of you to join me at Academia—let’s hunt together.
DYOR
Shieldsmine Diaries
Hey fam, let’s dive into my wild week in the gold market, from Sunday, April 20, 2025, to today, Friday, April 25, 2025. I’ve been hunting on the XAU/USD charts, balancing my love for trading with my other passions, and I’m here to break it all down for you—my strengths, my slip-ups, and everything in between. Grab a smoothie from Tastequest.com, spritz on some Icoca from Icon Collections Store, and let’s talk gold!
My Week in the Gold Market
Sunday, April 20, 2025: I kicked off the week with a deep dive into the XAU/USD 4-hour chart. Gold was sitting pretty around $3,400, still buzzing from the record high of $3,499.88 earlier in the week on April 22, as reported by LiteFinance. I spotted a potential pullback after the Shanghai Gold Exchange hit its 8th consecutive high, per BullionVault, and decided to wait for confirmation. My plan was to catch a dip using my harmonic patterns—something I’ve been mastering since my early trading days in 2020. I didn’t enter any trades yet, just stalked the market like a predator.
Monday, April 21, 2025:* Gold topped $3,400 after Trump’s comments on Fed Chair Powell sent the US dollar sliding, according to BullionVault. I saw an opportunity on the M30 chart and jumped in with a buy trade at $3,410, aiming for a quick 50-pip scalp—similar to my scalping strategies back in March when I targeted 20 pips on a 15-minute chart. I used my go-to tools: Heikin Ashi for trend confirmation and order blocks to pinpoint smart money zones. My entry was spot-on, and I closed the trade at $3,415, pocketing a solid win. But the market was volatile—gold later pulled back below $3,300 by the end of the day, a 2.3% drop from its peak, which had me second-guessing if I should’ve held longer.
Tuesday, April 22, 2025:
Gold hit that all-time high of $3,499.88, and I was hyped! I analyzed the 1-hour chart, spotting a Bullish Bat pattern forming, a setup I’ve been refining since my harmonic pattern deep dives. I entered a buy at $3,480, setting a tight stop-loss at $3,470 and a take-profit at $3,500, aiming for a 1:2 risk-reward ratio. The trade played out perfectly, hitting my target mid-day. But I missed a bigger move—gold futures later dropped to $3,300 by April 24, per Investopedia, and I could’ve flipped to a sell if I’d paid closer attention to the RSI showing overbought conditions, as noted by LiteFinance.
Wednesday, April 23, 2025:
The market got a breather as Trump softened his stance on tariffs, per Investopedia, and gold settled around $3,300. I decided to test a sell trade on the M30 chart after spotting a bearish shark pattern—part of the setup I shared in my follower note today. I entered at $3,310, with a stop-loss at $3,320 and a take-profit at $3,290, targeting the lower trendline of my descending channel. The trade hit my take-profit, but I noticed I was late on my entry; the neckline retest on the 15-minute chart had already happened, and I could’ve gotten in at $3,315 for a better risk-reward. My impatience cost me a few pips.
Thursday, April 24, 2025:
Gold was at $3,300, and I took a step back to analyze the bigger picture. The market was choppy after a 3.5% drop in gold futures, as Investopedia mentioned, and I didn’t want to get whipsawed. I focused on backtesting my strategy instead, refining my checklist with MACD and RSI for momentum—something I’ve been working on for six months. I also prepped my follower note, detailing the bearish three drives and head and shoulders patterns I’d been tracking, which played out today. No trades, but I felt sharp and ready.
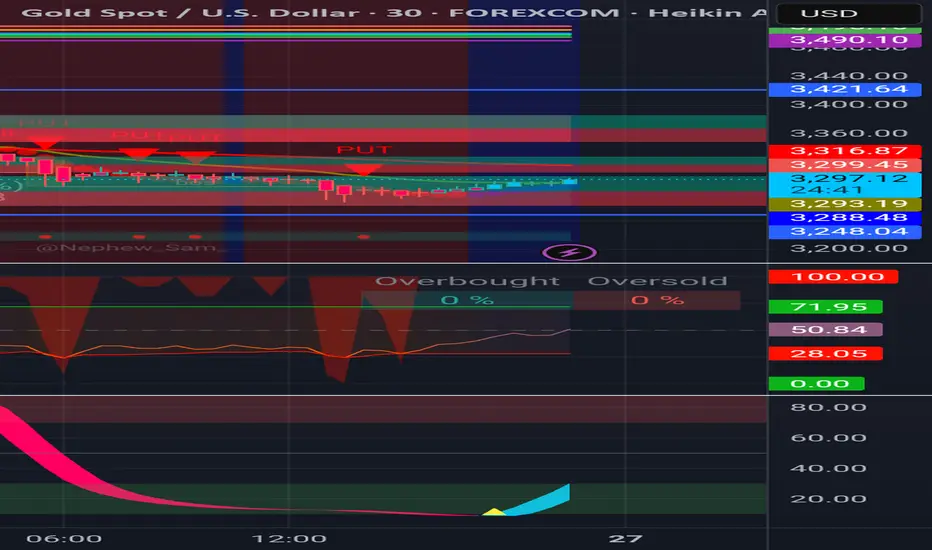
Friday, April 25, 2025 (Today):
Gold’s at $3,293.92, according to LiteFinance, and I’m wrapping up the week with my follower note on XAU/USD M30. I didn’t trade today—markets like MCX were closed for Good Friday earlier this week, and I’ve been cautious after Monday’s volatility. Instead, I shared my analysis: a bearish shark confirming the downtrend, with supply at the right shoulder of the head and shoulders and demand near the lower trendline. I’m still looking for two people to join me at Academia for Forex Trading—hit me up if you’re ready to hunt!
My Strengths
- Pattern Recognition: I’m a beast at spotting harmonic patterns like the Bullish Bat and Bearish Shark. My Tuesday buy trade at $3,480 was a textbook example of how I use Fibonacci ratios and market structure to nail entries.
- Discipline: I stuck to my checklist this week—waiting for Heikin Ashi confirmation and order blocks before jumping in. My Wednesday sell trade at $3,310 showed how I align every piece before striking.
- Adaptability: I’ve been trading gold since 2020, and I’ve learned to pivot fast. Monday’s quick scalp at $3,410 and my decision to sit out Thursday’s choppy market show I can read the market’s mood and act accordingly.
Areas of Weakness
- Overthinking Momentum: I missed a bigger move on Tuesday because I didn’t trust the RSI’s overbought signal. LiteFinance noted the bearish divergence, and I should’ve flipped to a sell sooner instead of chasing the uptrend.
- Timing Entries: Wednesday’s sell at $3,310 was late—I could’ve entered at $3,315 if I’d been more patient for the neckline retest. I need to work on timing my entries better, especially in volatile markets.
- Emotional Balance: My mother’s concern about my losses (like she mentioned today) got in my head mid-week. I stayed disciplined, but I need to better separate emotions from trading, especially after a string of stop-loss hits.
Vibe Check
So, what do you think, fam? Should I have gone for that sell on Tuesday, or was I right to lock in my profits? Drop your thoughts below—I’m curious to hear how you’d play this week’s XAU/USD moves! And if you’re one of the two ready to join me at Academia, let’s talk. We’ll hunt these markets together, using the same checklist that’s got me rating my system a ten out of ten. Oh, and while you’re at it, check out Icon Collections Store—grab a 6ml sample of RiverSide, Desire, or Icoca, and let me know which scent vibes with your trading energy!
Note for My Followers - April 25, 2025
Memo: Godshield Icon
I’m dropping this XAU/USD M30 insight because my system’s a damn executioner, and you need to see how I hunt the market. This chart is a textbook of bearish patterns—first a bearish three drives showing smart money exhausting buyers with three weakening upward pushes, then a head and shoulders with the neckline break confirming the reversal, and now a bearish shark forming to seal the deal, all playing out within my descending trendlines. Smart money’s been in control from the start, distributing at the peaks, grabbing liquidity, and dumping price to hunt stop-losses below key levels. Supply and demand zones are my edge—supply at the right shoulder of the head and shoulders where sellers stacked orders before the break, demand near the lower trendline where buyers might step in, my target for this bearish move. My checklist operations are a predator’s playbook. I start with harmonic patterns, hunting XABCD structures like the bearish shark I’m seeing now, signaling smart money’s reversal zones. I confirm market structure, looking for breaks of structure to show trend shifts—here, the neckline break confirms bearish continuation. I identify order blocks, those consolidation zones where smart money stacks orders, like the bearish order block at the right shoulder where sellers distributed. Volume profile is key—I check for high volume nodes where price stalls, like the neckline where sellers defended, and low volume nodes that act as magnets, like gaps below the neckline. Top-down analysis keeps me sharp—four-hour timeframe sets the bearish trend, one-hour confirms the break, thirty-minute narrows the setup, fifteen-minute is my strike zone, waiting for a neckline retest. I use Heikin Ashi for confirmation—red candles mean sell, waiting for red on the fifteen-minute at the retest. Fibonacci levels mark my targets—I focus on key extensions to set exits, like targeting the lower trendline of the channel. Gann theory adds confluence—I look for angles or retracements to align with my setups, like a Gann angle pointing to the lower trendline. MACD and RSI measure momentum—MACD’s bearish crossover and negative histogram confirm the downtrend, RSI below fifty with bearish divergence at the right shoulder seals it. Risk management is my law—I risk small to win big, stop-loss above the right shoulder, take-profit at the lower trendline, aiming for a high reward ratio. I monitor news and liquidity traps—fake spikes above the neckline are smart money’s tricks, so I stay sharp. I wait for confirmation—every piece aligns, or I walk, then I document to keep my edge razor-sharp. I’m rating this system a ten out of ten—harmonic patterns, Smart Money Concepts, volume profile, top-down analysis, and now MACD and RSI for momentum make it untouchable. I’ve fine-tuned this over six months, backtesting until it’s a weapon. I need two of you to join me at Academia—let’s hunt together.
DYOR
Shieldsmine Diaries
Penerbitan berkaitan
Penafian
Maklumat dan penerbitan adalah tidak dimaksudkan untuk menjadi, dan tidak membentuk, nasihat untuk kewangan, pelaburan, perdagangan dan jenis-jenis lain atau cadangan yang dibekalkan atau disahkan oleh TradingView. Baca dengan lebih lanjut di Terma Penggunaan.
Penerbitan berkaitan
Penafian
Maklumat dan penerbitan adalah tidak dimaksudkan untuk menjadi, dan tidak membentuk, nasihat untuk kewangan, pelaburan, perdagangan dan jenis-jenis lain atau cadangan yang dibekalkan atau disahkan oleh TradingView. Baca dengan lebih lanjut di Terma Penggunaan.