Gold (XAU/USD) – Daily Chart Analysis (Feb 25, 2025)
1. Market Structure & Trend Analysis
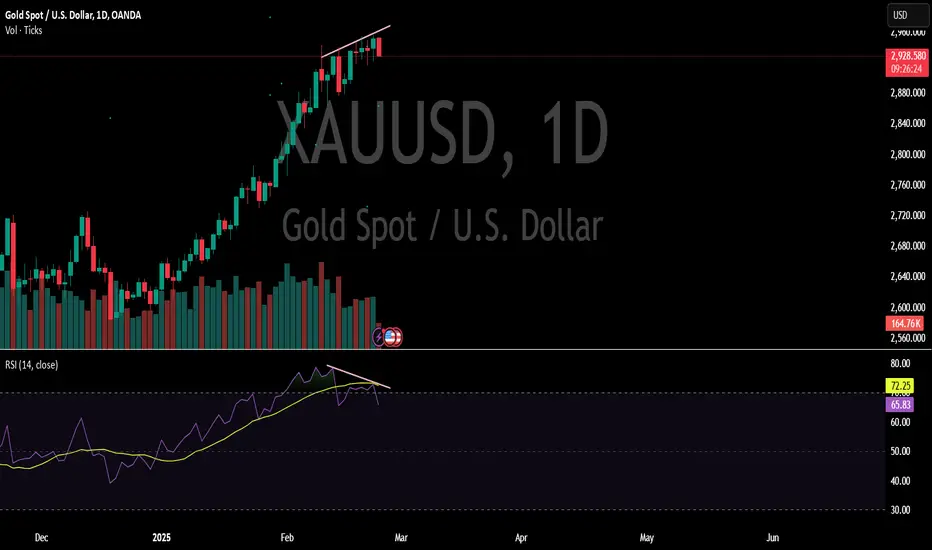
Gold is in a strong uptrend, recently hitting new highs near $2,953.
However, the chart shows a rising wedge pattern, which is a bearish reversal signal when broken to the downside.
The last few candles suggest potential weakness, as price action is struggling to push higher.
2. RSI & Momentum Analysis
Bearish RSI Divergence: The price has made higher highs, but the RSI has made lower highs, indicating weakening momentum.
RSI is currently at 68.71, close to the overbought zone (70), which suggests a potential pullback.
3. Key Levels to Watch
Resistance:
$2,953 - $2,960 (Recent all-time high, key breakout level)
$3,000 psychological level (If the rally continues)
Support:
$2,900 - $2,880 (First major support, previous breakout zone)
$2,850 - $2,820 (Stronger demand area if correction deepens)
4. Potential Trade Scenarios
📉 Bearish Scenario (High Probability)
If price breaks below the wedge, Gold could see a pullback towards $2,900 - $2,880.
Short setup: Entry on a confirmed breakdown with a stop above $2,960.
Downside target: $2,880 - $2,850.
📈 Bullish Continuation (Less Likely)
If Gold holds above $2,930 - $2,940, buyers may push it towards the key psychological level of $3,000.
Confirmation: Strong bullish candle with increasing volume.
5. Conclusion & Strategy
Short-term bias: Bearish due to rising wedge and RSI divergence.
Watch for breakdown confirmation below $2,930 for a pullback trade.
Long-term investors: Any correction to $2,850 - $2,820 could be a strong buying opportunity.
1. Market Structure & Trend Analysis
Gold is in a strong uptrend, recently hitting new highs near $2,953.
However, the chart shows a rising wedge pattern, which is a bearish reversal signal when broken to the downside.
The last few candles suggest potential weakness, as price action is struggling to push higher.
2. RSI & Momentum Analysis
Bearish RSI Divergence: The price has made higher highs, but the RSI has made lower highs, indicating weakening momentum.
RSI is currently at 68.71, close to the overbought zone (70), which suggests a potential pullback.
3. Key Levels to Watch
Resistance:
$2,953 - $2,960 (Recent all-time high, key breakout level)
$3,000 psychological level (If the rally continues)
Support:
$2,900 - $2,880 (First major support, previous breakout zone)
$2,850 - $2,820 (Stronger demand area if correction deepens)
4. Potential Trade Scenarios
📉 Bearish Scenario (High Probability)
If price breaks below the wedge, Gold could see a pullback towards $2,900 - $2,880.
Short setup: Entry on a confirmed breakdown with a stop above $2,960.
Downside target: $2,880 - $2,850.
📈 Bullish Continuation (Less Likely)
If Gold holds above $2,930 - $2,940, buyers may push it towards the key psychological level of $3,000.
Confirmation: Strong bullish candle with increasing volume.
5. Conclusion & Strategy
Short-term bias: Bearish due to rising wedge and RSI divergence.
Watch for breakdown confirmation below $2,930 for a pullback trade.
Long-term investors: Any correction to $2,850 - $2,820 could be a strong buying opportunity.
Penafian
Maklumat dan penerbitan adalah tidak dimaksudkan untuk menjadi, dan tidak membentuk, nasihat untuk kewangan, pelaburan, perdagangan dan jenis-jenis lain atau cadangan yang dibekalkan atau disahkan oleh TradingView. Baca dengan lebih lanjut di Terma Penggunaan.
Penafian
Maklumat dan penerbitan adalah tidak dimaksudkan untuk menjadi, dan tidak membentuk, nasihat untuk kewangan, pelaburan, perdagangan dan jenis-jenis lain atau cadangan yang dibekalkan atau disahkan oleh TradingView. Baca dengan lebih lanjut di Terma Penggunaan.