Hey everyone,
Please see our updated Daily chart route map with updated levels.
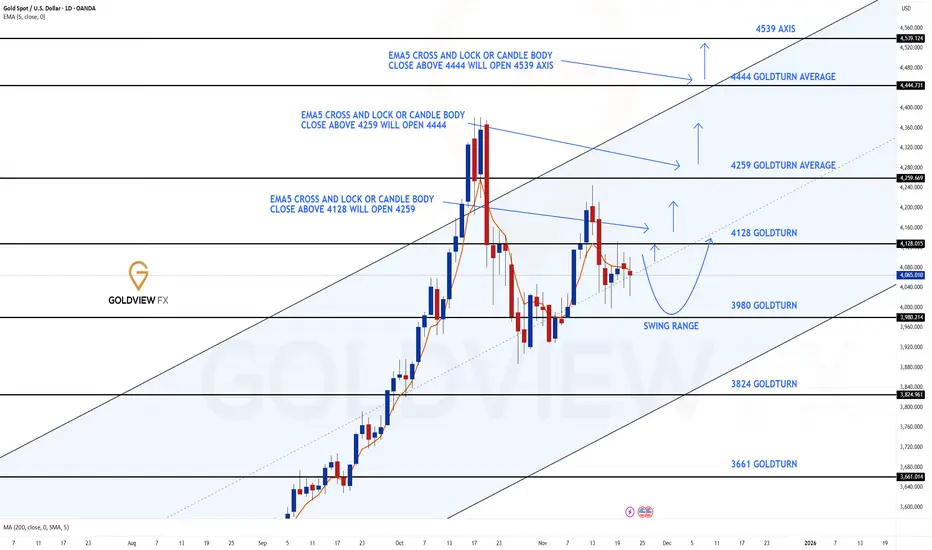
Price is currently playing between the longer daily chart range 4128 and 3980, with the channel half-line acting as support.
If this support holds, we should see a move toward the 4128 target. A body close or ema5 cross and lock below the half-line would open the swing range for a test and bounce. We're also watching for a break above 41238 to confirm a continuation above.
This is the beauty of our Goldturn channels, which we draw in our unique way, using averages rather than price. This enables us to identify fake-outs and breakouts clearly, as minimal noise in the way our channels are drawn.
We will use our smaller timeframe analysis on the 1H and 4H chart to buy dips from the weighted Goldturns for 30 to 40 pips clean. Ranging markets are perfectly suited for this type of trading, instead of trying to hold longer positions and getting chopped up in the swings up and down in the range.
We will keep the above in mind when taking buys from dips. Our updated levels and weighted levels will allow us to track the movement down and then catch bounces up using our smaller timeframe ideas.
Our long term bias is Bullish and therefore we look forward to drops from rejections, which allows us to continue to use our smaller timeframes to buy dips using our levels and setups.
Buying dips allows us to safely manage any swings rather then chasing the bull from the top.
Thank you all for your likes, comments and follows, we really appreciate it!
Mr Gold
GoldViewFX
Please see our updated Daily chart route map with updated levels.
Price is currently playing between the longer daily chart range 4128 and 3980, with the channel half-line acting as support.
If this support holds, we should see a move toward the 4128 target. A body close or ema5 cross and lock below the half-line would open the swing range for a test and bounce. We're also watching for a break above 41238 to confirm a continuation above.
This is the beauty of our Goldturn channels, which we draw in our unique way, using averages rather than price. This enables us to identify fake-outs and breakouts clearly, as minimal noise in the way our channels are drawn.
We will use our smaller timeframe analysis on the 1H and 4H chart to buy dips from the weighted Goldturns for 30 to 40 pips clean. Ranging markets are perfectly suited for this type of trading, instead of trying to hold longer positions and getting chopped up in the swings up and down in the range.
We will keep the above in mind when taking buys from dips. Our updated levels and weighted levels will allow us to track the movement down and then catch bounces up using our smaller timeframe ideas.
Our long term bias is Bullish and therefore we look forward to drops from rejections, which allows us to continue to use our smaller timeframes to buy dips using our levels and setups.
Buying dips allows us to safely manage any swings rather then chasing the bull from the top.
Thank you all for your likes, comments and follows, we really appreciate it!
Mr Gold
GoldViewFX
🪙 JOIN OUR FREE TELEGRAM GROUP 🪙 t.me/GoldView_FX
🪙 JOIN OUR DISCORD FOR BACKUP 🪙
discord.com/invite/9ZrEHGuaE2
🏆MESSAGE US FOR VIP SIGNALS🏆
t.me/GoldviewFX
or
email goldviewfx@gmail com
🪙 JOIN OUR DISCORD FOR BACKUP 🪙
discord.com/invite/9ZrEHGuaE2
🏆MESSAGE US FOR VIP SIGNALS🏆
t.me/GoldviewFX
or
email goldviewfx@gmail com
Penafian
The information and publications are not meant to be, and do not constitute, financial, investment, trading, or other types of advice or recommendations supplied or endorsed by TradingView. Read more in the Terms of Use.