I. Market Review and Current Status
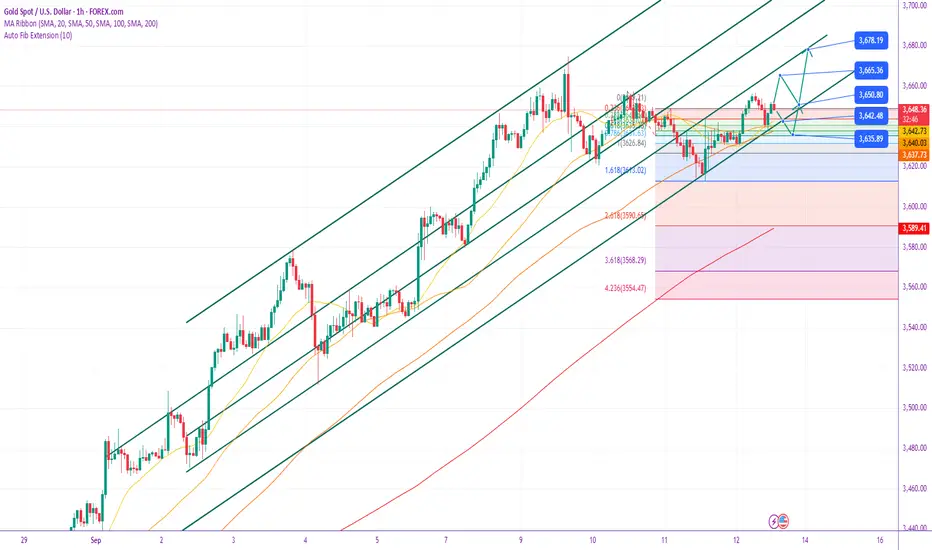
Yesterday, the gold market exhibited a classic "bottoming out and rebounding" pattern, perfectly illustrating its strong consolidation at high levels. During the Asian and European trading sessions, the price came under pressure at $3,650 and briefly broke below $3,620, reaching a low of $3,612. However, during the US trading session, bulls swiftly gained momentum, driven by the US initial jobless claims data. Gold prices surged nearly $30 in a short period of time, ultimately closing at $3,633 on the daily chart, a small bearish candlestick with a long lower shadow.
The key point is that the gold price failed to effectively fall below the 3620 area twice, confirming the existence of strong bullish support at this position. This shows that although gold prices have retreated after hitting a record high, the overall trend of the market is still dominated by bulls.
II. Technical Analysis
Trend Analysis:
Main Trend: The bullish trend remains intact. The pullback after the record high is a technical correction, not a trend reversal. The strong support below shows that the bull market foundation remains solid.
Short-term Status: Currently in a consolidation phase at a high level. This consolidation can be considered a "relay rest area" within the bullish trend, accumulating momentum for a subsequent upward move.
Key Price Levels:
Support Levels:
First Support: 3630-3635 (the starting point of yesterday's US market rally and the current hourly chart support).
Strong support: 3620-3612 area (yesterday’s double bottom low, the last line of defense for bulls).
Resistance Levels:
Initial Resistance: 3650 (yesterday's Asian market opening drop and previous high).
Key Resistance: 3674 (historical high).
Technical Indicators:
The 1-hour moving average has begun to turn upward after a rally, providing short-term price support.
The daily candlestick pattern with a long lower shadow is a strong bullish signal, indicating strong buying interest at low levels.
III. Trading Strategy Recommendations
Direction: Buy on dips.
Entry Area: Near 3635. Stop-loss: 3625 (placed below the strong support level of 3620, leaving some room for market fluctuations).
Targets:
First target: 3650 (a breakout above this level could lead to further gains).
Second target: 3658-3665 area.
IV. Risk Warning
If gold prices unexpectedly fall below the strong support level of 3620, the short-term volatile pattern could be prolonged, or even lead to a deep pullback to the 3600 level. Traders should closely monitor the defense of this level and adjust their strategies accordingly.
Summary:
Gold's bullish trend remains unchanged, and the current high-level fluctuations are a period of accumulation. In terms of operation, we should follow the main trend and focus on looking for opportunities to go long at low levels. The key support area is 3630-3635. Set stop loss strictly and keep a close eye on the 3620 bull-bear watershed.
Dagangan aktif
Latest Gold Forecast and Analysis for September 15th:
I. Core Viewpoint
The gold market is expected to remain volatile and relatively strong at high levels next week (especially before the Federal Reserve's interest rate decision). The bullish trend remains intact, but there is a risk of a short-term technical correction. The market's focus will be entirely on the Fed's interest rate decision and subsequent policy guidance, which may determine whether gold prices reach new highs or experience a deep correction.
II. Fundamental Analysis
Expectations of a Strengthened Rate Cut (Major Bullish Factor):
Core Driver: Recent US economic data, particularly labor market data (a sharp increase in initial jobless claims, weak non-farm payroll data, and downward revisions to historical employment data), have reinforced market expectations that the Fed is about to begin a cycle of rate cuts.
Market Logic: Expectations of a rate cut have led to a weakening US dollar and lower US Treasury yields, reducing the opportunity cost of holding non-interest-bearing gold and significantly boosting its appeal. This is the fundamental reason that has driven gold prices higher for four consecutive weeks and reached a new record high.
Next Week's Key Event: The Fed's Interest Rate Decision (Key Uncertainty):
The market has largely priced in the expectation of a "first rate cut" next week. The key to the decision lies not in whether or not to cut interest rates, but in the Fed's "dot plot" and Summary of Economic Projections (SEP).
Potentially bullish scenario: If the Fed sends clear dovish signals (such as confirming a path of multiple rate cuts this year), gold prices could surge directly and break through all-time highs.
Potentially bearish scenario: If the Fed takes a hawkish stance (such as expressing concerns about inflation, suggesting a slower pace of rate cuts), this could lead to a "realization of expectations, exhaustion of positive news" market, triggering large-scale profit-taking and a deep correction in gold prices.
III. Technical Analysis
Daily Chart - Bullish Trend
Bull market intact: Gold prices are trading above all major moving averages (MAs), and the MAs are in a perfect bullish alignment, providing strong trend support.
Key Support: The $3,600 mark has transformed from resistance to key support. Further support lies in the $3,550-3,530 area (near the MA20 level and the previous consolidation zone).
Target and Risk: Technical patterns support a move to higher prices, but be wary of news-driven reversals.
4-Hour Chart - Beware of a short-term pullback risk.
Divergence Signal: The MACD indicator may form a death cross, a warning sign that upward momentum is weakening and diverging from the record high, suggesting a need for a short-term technical correction.
Short-Term Support: The 3630-3625 area is the first key line of defense for bulls in the near term. If broken, a further pullback to the 3600-3580 area (the intersection of the 4-hour MA60 and the daily MA5) is possible.
Short-Term Resistance: The 3655-3660 area is immediate resistance, while the historical high of 3674 is a strong psychological resistance level.
IV. Trading Strategy Recommendations
Overall Approach: Ahead of the Fed's decision, the market may be cautious, with high-level fluctuations prevalent. In terms of operation, you should be cautious in chasing high prices, mainly arrange long orders after a pullback, and try shorting with a light position at key resistance levels.
Long Strategy (Long on Dips):
Ideal Long Zone: After a pullback to the 3630-3625 support range and stabilization, consider a light long position.
Conservative Long Zone: If the pullback deepens, look for dip buying opportunities in the 3600-3580 range.
Target: Target 3650 or 3660. After a breakout, hold and pursue new highs.
Stop-Loss: Place $6-8$ below the entry level.
Short Strategy (Short on Highs):
Opportunities: If the rebound to the 3655-3660 resistance range stagnates, or if the price retests the historical highs of 3670-3674 and fails to break through, consider a light short position.
Target: Target 3640 or 3630.
Stop-Loss: Place above 3675.
Note: This strategy is intended only for technical pullbacks and is a short-term contrarian trade. Maintain a light position and maintain a strict stop-loss.
5. Key Risk Warnings
Federal Reserve Decision Risk: This is the biggest source of uncertainty next week and could trigger significant market volatility. Be sure to manage your positions carefully.
Technical Sell-Off Risk: Gold prices have risen significantly this year, accumulating significant profit-taking. Any disruption could trigger a technical sell-off, leading to a larger-than-expected correction.
Penerbitan berkaitan
Penafian
Maklumat dan penerbitan adalah tidak dimaksudkan untuk menjadi, dan tidak membentuk, nasihat untuk kewangan, pelaburan, perdagangan dan jenis-jenis lain atau cadangan yang dibekalkan atau disahkan oleh TradingView. Baca dengan lebih lanjut di Terma Penggunaan.
Penerbitan berkaitan
Penafian
Maklumat dan penerbitan adalah tidak dimaksudkan untuk menjadi, dan tidak membentuk, nasihat untuk kewangan, pelaburan, perdagangan dan jenis-jenis lain atau cadangan yang dibekalkan atau disahkan oleh TradingView. Baca dengan lebih lanjut di Terma Penggunaan.