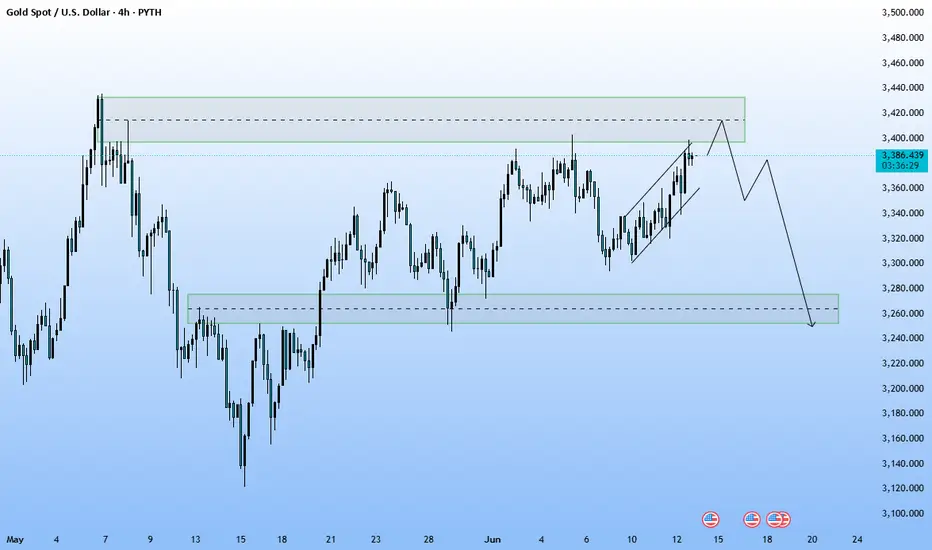
Chart Overview (4H Timeframe - USD Pair):
This is a 4-hour timeframe chart of a USD-based pair (possibly from a synthetic feed, as it's labeled "PYTH"). It shows a clear technical setup with projected movements.
Key Observations:
1. Current Pattern:
The price is currently moving inside a rising wedge, which is typically a bearish reversal pattern.
The wedge is nearing a resistance zone (highlighted by a green box at the top).
2. Resistance Zone:
This area is between approximately 3.400.000 to 3.420.000.
Price is expected to reach this zone, potentially triggering selling pressure.
3. Support Zone:
The lower green box indicates a support area around 3.260.000 to 3.280.000.
This is the potential target if the price breaks down from the wedge.
Projected Price Action:
The chart shows two key projections:
A short-term bullish move to the resistance zone.
Followed by a bearish reversal, breaking below the wedge and heading toward the support zone.
Trading Implications:
If you're trading this setup:
Watch for bearish confirmation (like rejection candles or bearish engulfing patterns) once price enters the resistance zone.
A breakdown from the rising wedge would be your signal to go short, targeting the lower support zone.
It's a classic setup where "buy the rumor, sell the news" psychology might be at play — short-term rise, then sharp fall.
Dagangan aktif
Active Trade.Penafian
Maklumat dan penerbitan adalah tidak dimaksudkan untuk menjadi, dan tidak membentuk, nasihat untuk kewangan, pelaburan, perdagangan dan jenis-jenis lain atau cadangan yang dibekalkan atau disahkan oleh TradingView. Baca dengan lebih lanjut di Terma Penggunaan.
Penafian
Maklumat dan penerbitan adalah tidak dimaksudkan untuk menjadi, dan tidak membentuk, nasihat untuk kewangan, pelaburan, perdagangan dan jenis-jenis lain atau cadangan yang dibekalkan atau disahkan oleh TradingView. Baca dengan lebih lanjut di Terma Penggunaan.