Gold is being compressed, the upcoming US data week will decide which side gets squeezed.
Good evening everyone, Brian here with a view on XAUUSD on the H2 and H4 frames for the upcoming week.
Fundamental Analysis – a "tailor-made" week for the USD
Next week is packed with US data, meaning gold will react more to numbers than narratives:
Core PPI, PPI, and Retail Sales
Initial Unemployment Claims
Prelim GDP q/q
Core PCE Price Index m/m – the Fed's preferred inflation gauge
If inflation and growth come out weak, the market will lean more towards the slow growth / easing policy narrative. This usually pressures the USD and supports gold, especially as real yields gradually decline.
Conversely, stronger-than-expected data will strengthen the USD, raise yields, and create short-term downward pressure on gold. In such a context, price and liquidity areas around news releases will be more important than usual – typically, fading emotional spikes back to structural areas is safer than chasing the initial move.
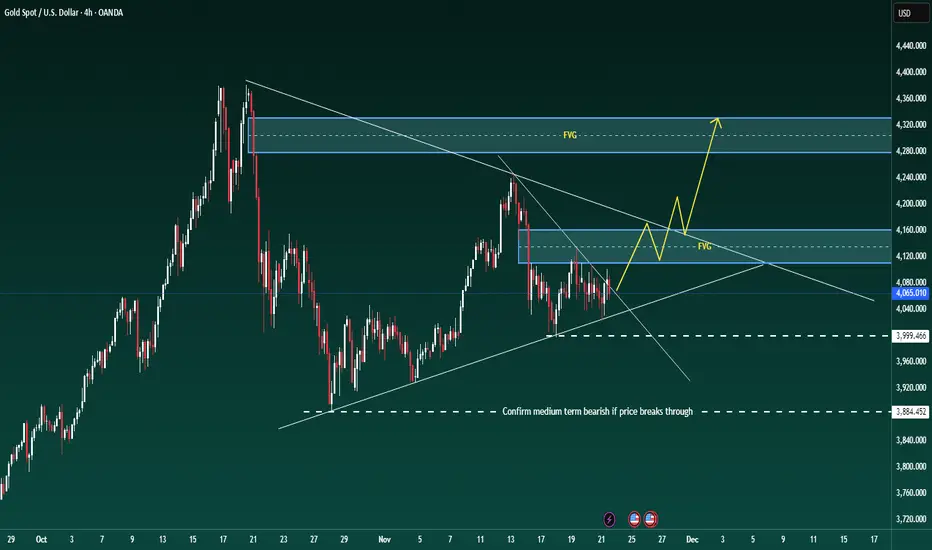
Technical Analysis – triangle, FVG, and key support areas
On the H4 frame, gold is still trading within a broad triangle structure. The previous decline has stalled, with prices continuously reacting at the upward support line and around 4,000, but there has yet to be a clear breakout from the pattern.
When zooming into H1–H2:
The price has broken a short-term downtrend line and closed strongly above – this is an early signal that selling pressure in this move is weakening.
The nearest support is around 4050–4040, deeper is the support band 4000–3998 (marked on the chart as important support). As long as it holds above 4,000, the structure remains positive.
Above, we have a very important confluence area around 4135–4160 including:
Fibo 0.382 of the most recent main decline
An old fair value gap (FVG) and resistance block
Chart note: "Gold will go strong if it passes this price range" – aligns with my view: if the price accepts above this area, the potential for a stronger upward move will open up.
Around 4100 is an area prone to a "large liquidity response" – expect strong profit-taking and position restructuring if the price returns to this area.
Currently, I see the market as accumulating above 4,000 in a corrective pattern, with a slight upward bias as long as 4,000 is maintained.
Key Price Areas
Resistance:
4100 – first liquidity area
4135–4160 – Fibo 0.382 + FVG + strong resistance
Support:
4050–4040 – nearest intraday support
4000–3998 – large frame support; if broken, it will change the picture
3940 area – stronger support if 4k is breached
Trading Scenarios for Next Week
(All are for reference only, not investment advice.)
Scenario 1 – Buy when the price adjusts above 4,000 (foundation for the next upward wave)
Idea: follow the forming upward bias as the price still respects the triangle support and the 4,000 mark.
Entry area: 4050–4040 or any clean retest of the broken downtrend line on smaller frames
Area for cautious position addition: 4025–4005 if there is a deep sweep to 4,000 with a strong rebound reaction
Stop Loss: below 3990–3988 depending on risk appetite
Targets:
First: 4100 (liquidity area)
Second: 4135–4140 (lower edge of FVG/resistance)
Extended: 4155–4160 if a strong continuation move appears
Signals to wait for: wick rejection from support, bullish engulfing candle, or clear intraday structural phase shift to a series of higher highs and lows.
Scenario 2 – Break & Retest Long above 4135–4140
If the price does not give a deep adjustment but runs straight up:
Condition: H2/H4 candle closes clearly above 4135–4140 and holds when retesting
Entry: when the price pulls back in a controlled manner to the 4135–4140 area, turning this area from resistance to support
SL: below 4120
TP: 4180 → 4200+ depending on momentum strength
This is the "gold goes strong" scenario as noted on the chart – viewing the FVG/0.382 area as a launchpad for a larger impulse wave.
Scenario 3 – Bearish scenario if 4,000 is broken
If fundamentals and cash flow turn against gold, decisively pushing the price below 4,000, the bullish view needs to be set aside.
Condition: daily candle closes clearly below 4000–3998
Plan: wait for the price to retrace up to retest 4000–4020 from below
Entry: short when rejection signals appear at that retest area
TP: 3960 → 3940, then reassess the structure
When below 4,000, the triangle will break down, and the market is likely to hunt deeper liquidity areas before potentially forming a new medium-term upward wave.
In summary: as long as 4,000 holds, I prioritize the buy scenario on adjustments, respecting the upward potential to 4135–4160 and beyond. If there is a decisive break below 4,000, the picture will reverse – then retracements up will be opportunities to look for shorts.
Trade according to what the structure shows, not what I hope for. Manage risk tightly around next week's data points and let the major price areas "do the heavy lifting."
If this perspective helps you plan better, don't forget to follow Brian for weekly gold analysis and share your scenarios in the comments to compare.
Good evening everyone, Brian here with a view on XAUUSD on the H2 and H4 frames for the upcoming week.
Fundamental Analysis – a "tailor-made" week for the USD
Next week is packed with US data, meaning gold will react more to numbers than narratives:
Core PPI, PPI, and Retail Sales
Initial Unemployment Claims
Prelim GDP q/q
Core PCE Price Index m/m – the Fed's preferred inflation gauge
If inflation and growth come out weak, the market will lean more towards the slow growth / easing policy narrative. This usually pressures the USD and supports gold, especially as real yields gradually decline.
Conversely, stronger-than-expected data will strengthen the USD, raise yields, and create short-term downward pressure on gold. In such a context, price and liquidity areas around news releases will be more important than usual – typically, fading emotional spikes back to structural areas is safer than chasing the initial move.
Technical Analysis – triangle, FVG, and key support areas
On the H4 frame, gold is still trading within a broad triangle structure. The previous decline has stalled, with prices continuously reacting at the upward support line and around 4,000, but there has yet to be a clear breakout from the pattern.
When zooming into H1–H2:
The price has broken a short-term downtrend line and closed strongly above – this is an early signal that selling pressure in this move is weakening.
The nearest support is around 4050–4040, deeper is the support band 4000–3998 (marked on the chart as important support). As long as it holds above 4,000, the structure remains positive.
Above, we have a very important confluence area around 4135–4160 including:
Fibo 0.382 of the most recent main decline
An old fair value gap (FVG) and resistance block
Chart note: "Gold will go strong if it passes this price range" – aligns with my view: if the price accepts above this area, the potential for a stronger upward move will open up.
Around 4100 is an area prone to a "large liquidity response" – expect strong profit-taking and position restructuring if the price returns to this area.
Currently, I see the market as accumulating above 4,000 in a corrective pattern, with a slight upward bias as long as 4,000 is maintained.
Key Price Areas
Resistance:
4100 – first liquidity area
4135–4160 – Fibo 0.382 + FVG + strong resistance
Support:
4050–4040 – nearest intraday support
4000–3998 – large frame support; if broken, it will change the picture
3940 area – stronger support if 4k is breached
Trading Scenarios for Next Week
(All are for reference only, not investment advice.)
Scenario 1 – Buy when the price adjusts above 4,000 (foundation for the next upward wave)
Idea: follow the forming upward bias as the price still respects the triangle support and the 4,000 mark.
Entry area: 4050–4040 or any clean retest of the broken downtrend line on smaller frames
Area for cautious position addition: 4025–4005 if there is a deep sweep to 4,000 with a strong rebound reaction
Stop Loss: below 3990–3988 depending on risk appetite
Targets:
First: 4100 (liquidity area)
Second: 4135–4140 (lower edge of FVG/resistance)
Extended: 4155–4160 if a strong continuation move appears
Signals to wait for: wick rejection from support, bullish engulfing candle, or clear intraday structural phase shift to a series of higher highs and lows.
Scenario 2 – Break & Retest Long above 4135–4140
If the price does not give a deep adjustment but runs straight up:
Condition: H2/H4 candle closes clearly above 4135–4140 and holds when retesting
Entry: when the price pulls back in a controlled manner to the 4135–4140 area, turning this area from resistance to support
SL: below 4120
TP: 4180 → 4200+ depending on momentum strength
This is the "gold goes strong" scenario as noted on the chart – viewing the FVG/0.382 area as a launchpad for a larger impulse wave.
Scenario 3 – Bearish scenario if 4,000 is broken
If fundamentals and cash flow turn against gold, decisively pushing the price below 4,000, the bullish view needs to be set aside.
Condition: daily candle closes clearly below 4000–3998
Plan: wait for the price to retrace up to retest 4000–4020 from below
Entry: short when rejection signals appear at that retest area
TP: 3960 → 3940, then reassess the structure
When below 4,000, the triangle will break down, and the market is likely to hunt deeper liquidity areas before potentially forming a new medium-term upward wave.
In summary: as long as 4,000 holds, I prioritize the buy scenario on adjustments, respecting the upward potential to 4135–4160 and beyond. If there is a decisive break below 4,000, the picture will reverse – then retracements up will be opportunities to look for shorts.
Trade according to what the structure shows, not what I hope for. Manage risk tightly around next week's data points and let the major price areas "do the heavy lifting."
If this perspective helps you plan better, don't forget to follow Brian for weekly gold analysis and share your scenarios in the comments to compare.
🔥 BrianLionCapital – Where Top Traders Unite
✅ Accurate signals & exclusive analysis: 10–15 signals daily with continuous market insights
⏳ Every minute you hesitate is a winning opportunity slipping away!
t.me/+-C-Pc_SOCPRjMmQ9
✅ Accurate signals & exclusive analysis: 10–15 signals daily with continuous market insights
⏳ Every minute you hesitate is a winning opportunity slipping away!
t.me/+-C-Pc_SOCPRjMmQ9
Penerbitan berkaitan
Penafian
The information and publications are not meant to be, and do not constitute, financial, investment, trading, or other types of advice or recommendations supplied or endorsed by TradingView. Read more in the Terms of Use.