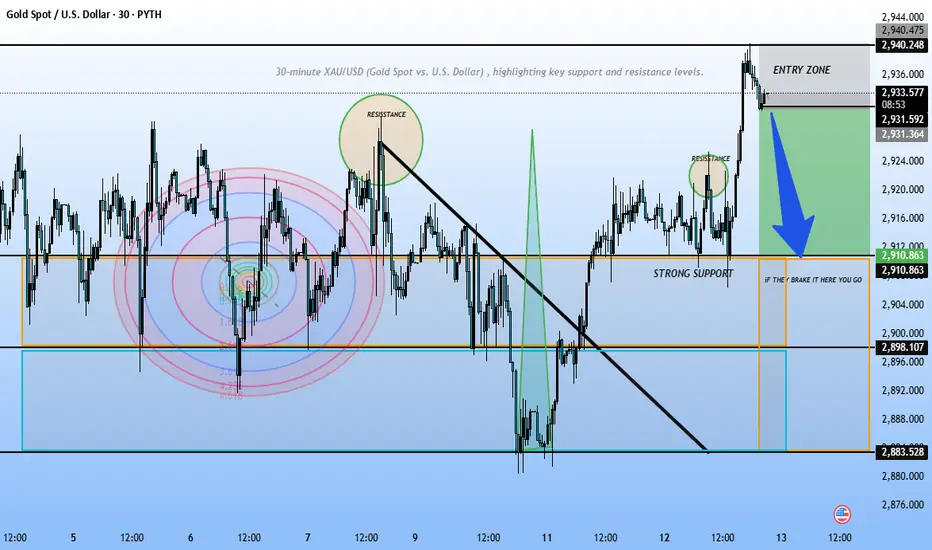
30-minute Gold Spot (XAU/USD) , using data from the PYTH exchange.
Chart Breakdown
1. Entry Zone:
• The price has recently surged into the entry zone, marked near $2,940.
• A possible rejection from this level is indicated by the blue arrow pointing downward, suggesting a bearish move.
2. Resistance & Support Levels:
• Resistance: Around $2,940 - $2,944, where price is currently struggling.
• Strong Support: Identified near $2,910 - $2,903, which may act as a key level for a pullback.
• A broader support zone is visible around $2,888 - $2,890.
3. Technical Patterns:
• A Fibonacci-style circular pattern is drawn, possibly indicating a key liquidity zone.
• A previous rejection area is marked, which aligns with the current price action.
Conclusion
This setup suggests a potential short trade from the entry zone. If price fails to break above $2,940, it may retrace towards $2,910 - $2,903, with a further drop possible if that support breaks. However, if price breaks and holds above $2,944, the bearish setup may become invalid.
Penafian
Maklumat dan penerbitan adalah tidak dimaksudkan untuk menjadi, dan tidak membentuk, nasihat untuk kewangan, pelaburan, perdagangan dan jenis-jenis lain atau cadangan yang dibekalkan atau disahkan oleh TradingView. Baca dengan lebih lanjut di Terma Penggunaan.
Penafian
Maklumat dan penerbitan adalah tidak dimaksudkan untuk menjadi, dan tidak membentuk, nasihat untuk kewangan, pelaburan, perdagangan dan jenis-jenis lain atau cadangan yang dibekalkan atau disahkan oleh TradingView. Baca dengan lebih lanjut di Terma Penggunaan.