Gold Trend Analysis: A Strong Bullish Pattern, Maintaining a Trend-Following Buy
The gold market maintained its bullish momentum this week, strengthening after today's opening and successfully holding above $3,600 during the European trading session. Despite a pullback after a sharp rally, gold prices showed no signs of a significant unilateral decline, closing around $3,586, demonstrating a strong bullish trend.
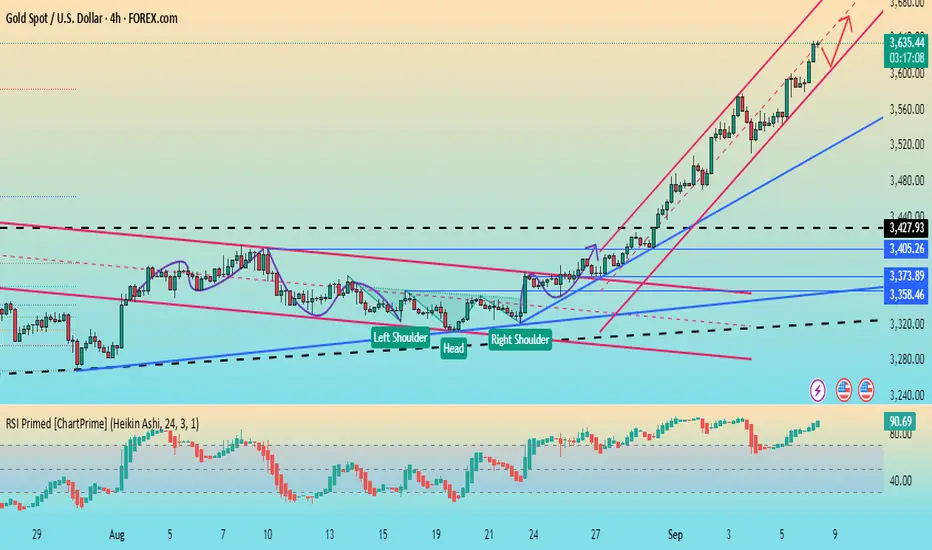
Daily candlestick patterns indicate that gold prices closed with a volatile breakout above a high-mid-range candlestick. After Thursday's volatile correction, the market staged a strong rebound on Friday, further extending its breakout pattern. Currently, both technical indicators and price patterns indicate a clear bullish trend. In this environment, investors should avoid speculating on tops or fighting the trend, instead trading in line with the trend.
Technical Analysis and Trading Strategies
Currently, short-term support is focused on the $3,590 level. A more significant support level lies at $3,575, which could serve as a short-term bullish trend line. As long as the daily chart holds above this level, buying on dips and following the trend remains the key strategy.
Specific trading recommendations:
Buy in batches if the price retraces to the 3590-3598 range.
Add to long positions if the price further retraces to the 3568-3575 range.
Set a unified stop-loss below 3559.
Target the 3615-3620 area; hold if it breaks.
Risk Warning: This week, focus on Thursday's US CPI data, which could cause short-term market fluctuations. However, against a generally light data backdrop, technical analysis will continue to dominate gold's performance. Investors should strictly control their positions and manage risk effectively to avoid disruptions to their overall trading plans due to short-term fluctuations.
The gold market maintained its bullish momentum this week, strengthening after today's opening and successfully holding above $3,600 during the European trading session. Despite a pullback after a sharp rally, gold prices showed no signs of a significant unilateral decline, closing around $3,586, demonstrating a strong bullish trend.
Daily candlestick patterns indicate that gold prices closed with a volatile breakout above a high-mid-range candlestick. After Thursday's volatile correction, the market staged a strong rebound on Friday, further extending its breakout pattern. Currently, both technical indicators and price patterns indicate a clear bullish trend. In this environment, investors should avoid speculating on tops or fighting the trend, instead trading in line with the trend.
Technical Analysis and Trading Strategies
Currently, short-term support is focused on the $3,590 level. A more significant support level lies at $3,575, which could serve as a short-term bullish trend line. As long as the daily chart holds above this level, buying on dips and following the trend remains the key strategy.
Specific trading recommendations:
Buy in batches if the price retraces to the 3590-3598 range.
Add to long positions if the price further retraces to the 3568-3575 range.
Set a unified stop-loss below 3559.
Target the 3615-3620 area; hold if it breaks.
Risk Warning: This week, focus on Thursday's US CPI data, which could cause short-term market fluctuations. However, against a generally light data backdrop, technical analysis will continue to dominate gold's performance. Investors should strictly control their positions and manage risk effectively to avoid disruptions to their overall trading plans due to short-term fluctuations.
Free Signals:t.me/+5LF4e2Pi0-Q0NDNh
Penafian
Maklumat dan penerbitan adalah tidak dimaksudkan untuk menjadi, dan tidak membentuk, nasihat untuk kewangan, pelaburan, perdagangan dan jenis-jenis lain atau cadangan yang dibekalkan atau disahkan oleh TradingView. Baca dengan lebih lanjut di Terma Penggunaan.