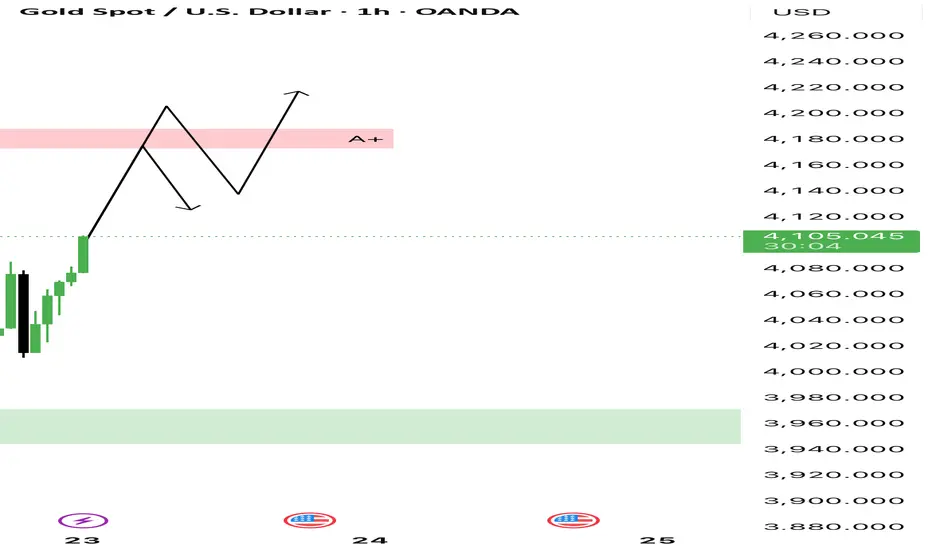
This chart shows a corrective wave structure (A–B–C), indicating that the market has likely completed its downward correction phase and is now gearing up for a potential bullish continuation.
• Wave (A) – Strong bearish leg marking the start of the correction.
• Wave (B) – A temporary pullback before continuation lower.
• Wave (C) – Final push down completing the correction, ending near the green demand zone (3,950–3,980).
• After the completion of Wave (C), buyers are showing strength, pushing price back above the short-term structure.
• The pink zone represents a key supply / resistance area where price may react or consolidate before the next move up.
📈 Trade Idea:
Wait for a retest and bullish confirmation around the pink zone (previous resistance).
If the market holds and forms higher lows, a potential long setup targeting new highs (above 4,200) could form.
Penafian
Maklumat dan penerbitan adalah tidak dimaksudkan untuk menjadi, dan tidak membentuk, nasihat untuk kewangan, pelaburan, perdagangan dan jenis-jenis lain atau cadangan yang dibekalkan atau disahkan oleh TradingView. Baca dengan lebih lanjut di Terma Penggunaan.
Penafian
Maklumat dan penerbitan adalah tidak dimaksudkan untuk menjadi, dan tidak membentuk, nasihat untuk kewangan, pelaburan, perdagangan dan jenis-jenis lain atau cadangan yang dibekalkan atau disahkan oleh TradingView. Baca dengan lebih lanjut di Terma Penggunaan.