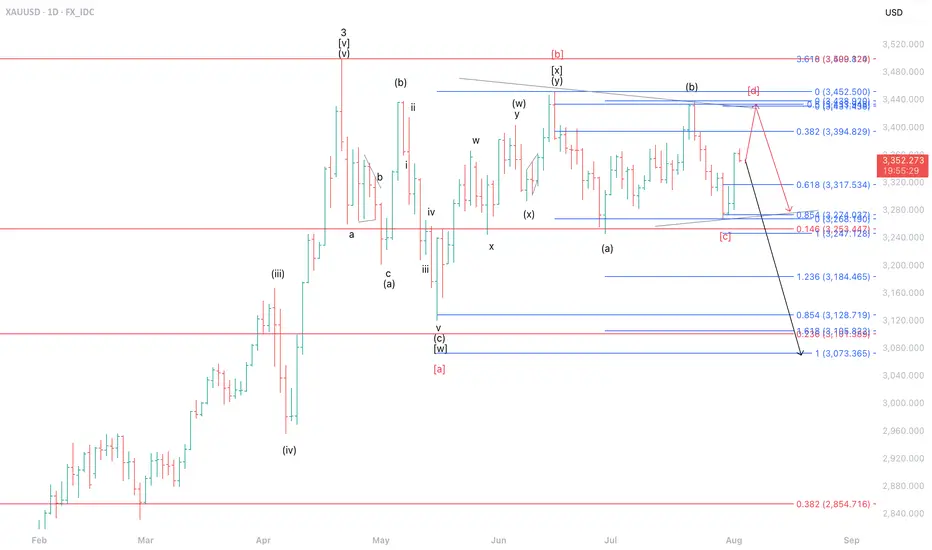
The current movement of gold (XAUUSD) is estimated to be forming part of wave ii of wave (c) of wave [y] under the black label scenario. This implies that XAUUSD has the potential to undergo a deeper correction, targeting the 3,073–3,184 range.
However, under the alternative red label, the price action appears to be developing a triangle pattern as part of wave [d] of wave 4. In this scenario, XAUUSD still holds the potential for further upside toward the 3,394–3,438 area, which also coincides with a Fibonacci cluster zone, serving as a critical resistance region.
However, under the alternative red label, the price action appears to be developing a triangle pattern as part of wave [d] of wave 4. In this scenario, XAUUSD still holds the potential for further upside toward the 3,394–3,438 area, which also coincides with a Fibonacci cluster zone, serving as a critical resistance region.
Penafian
Maklumat dan penerbitan adalah tidak dimaksudkan untuk menjadi, dan tidak membentuk, nasihat untuk kewangan, pelaburan, perdagangan dan jenis-jenis lain atau cadangan yang dibekalkan atau disahkan oleh TradingView. Baca dengan lebih lanjut di Terma Penggunaan.
Penafian
Maklumat dan penerbitan adalah tidak dimaksudkan untuk menjadi, dan tidak membentuk, nasihat untuk kewangan, pelaburan, perdagangan dan jenis-jenis lain atau cadangan yang dibekalkan atau disahkan oleh TradingView. Baca dengan lebih lanjut di Terma Penggunaan.