Gold Trading Strategy Essentials for Tuesday, September 9th:
I. Core Drivers and Risks (Fundamentals)
Bullient Factors Dominate:
Expectations of a Stronger Rate Cut: The US August non-farm payroll data fell far short of expectations, leaving the market with near-100% expectations for a 25 basis point rate cut by the Federal Reserve in September. A weaker US dollar and falling US Treasury yields continue to favor gold.
Strong Safe-Haven Demand: The escalating Russia-Ukraine conflict and heightened global geopolitical risks are boosting gold's safe-haven appeal.
Solid Structural Support: Continued gold purchases by global central banks (such as the People's Bank of China) provide long-term support for gold prices.
Potential Risk Points:
Data Risk: US CPI and PPI data will be released. If inflation data exceeds expectations and is strong, it could weaken expectations of a rate cut and weigh on gold prices.
Technical pullback: The price of gold has risen sharply this year, and the short-term technical indicator (RSI) has diverged, and there is pressure for a technical pullback.
Federal Reserve Signals: Be wary of volatility triggered by any hawkish signals in the outcome of the interest rate meeting or the policy statement.
II. Key Technical Levels (Spot Gold)
Current Price: 3645
Resistance: 3658 (Recent High) → 3700 (Psychological Barrier)
Support: 3620 (Initial Support) → 3600 (Key Psychological Level) → 3550.46 (Strong Support)
III. Trading Strategy and Risk Management
Overall Approach: The medium- to long-term bullish trend remains unchanged, but the market is currently at a critical resistance level. Avoid chasing highs. The primary strategy is to buy on dips after pullbacks, supplemented by using a very light position to capture short-term pullbacks.
[Primary Strategy] Buy on Pullbacks
Entry Area: Expect a small long position when the 3600-3620 range stabilizes (for more cautious traders, wait for the 3550-3570 area).
Stop loss: Place it at $8-10 below the entry level (e.g., for a long order at $3,600, the stop loss is set at $3,590-3,592).
Target: First look at 3650 - 3658, after breaking through, you can hold and look up to 3680 - 3700.
[Supplementary Strategy] Aggressive Short-Term Selling (Experienced Traders Only)
Entry Signal: A rapid price rise to 3658 or above, accompanied by clear resistance signals (such as a long upper shadow on the 15-minute/1-hour candlestick chart or a top divergence on the RSI).
Position: A small position.
Stop-loss: Must be set strictly $5 above the entry level (e.g., for a short position at 3660, stop-loss at 3665).
Target: Enter and exit quickly to capture 20$-30$pullback profits (such as around 3630).
[Risk Management Tips]
Position Management: Risk exposure on a single trade must be strictly controlled within 1-2% of total capital.
Forced Stop-loss: A stop-loss must be set on all trades to prevent unexpected large losses.
Dagangan aktif
Gold Trading Strategy
Core Theory: Bullish with the trend, go long on pullbacks to key support levels.
I. Key Technical Levels
Short-term Strong Support: Around 3630-3635
Downward Core Support: 3610-3613
Bull Vital Line: 3600 (Daily Strength Dividing Line)
II. Trading Strategy
Direction: Long
Trading Plan:
Entry Area: Go long when the gold price retraces to the 3625-3630 range.
Risk Control (Stop-Loss): Set the stop-loss at 3617.
Target Price:
First Target: 3675-3680.
Subsequent Action: If the price successfully reaches the first target and breaks through strongly, continue holding, eyeing higher resistance levels.
III. Logic Summary
Trend Analysis: The current market is in a bullish trend, and the underlying strategy is to "go long with the trend."
Support: The 3610-3635 area is a key intraday support zone, while the 3600 level is the final line of defense maintaining the daily bullish trend. As long as the price stabilizes above this level, the bullish trend remains intact.
Risk-Reward Ratio: This strategy's entry point, stop-loss, and target points are well-designed, providing a good risk-reward ratio.
IV. Risk Warning: If the gold price unexpectedly falls below the 3,600 mark, the current bullish trend will need to be reassessed, and the strategy may become ineffective.
Please pay attention to controlling your positions, strictly set stop-loss orders, and guard against market volatility risks caused by sudden news.
Dagangan ditutup: sasaran tercapai
Latest Gold Market Trend Analysis and Strategy:
I. Core Viewpoint
Gold has entered a period of high-level volatility after reaching a new all-time high. The bullish trend remains intact, but it faces a dual challenge in the short term from technical corrections and fundamental events (US inflation data). Market sentiment has become cautious, and trading strategies should prioritize a cautious bullish outlook and be wary of pullbacks.
II. News Analysis:
Reasons for the Roller Coaster Market:
Record-breaking Momentum: Revised US employment data, worse than expected, reinforced market expectations that the Federal Reserve may slow its tightening pace, which was the core driver of gold's new highs.
Profit-taking Pressure: After gold prices continued to rise and hit new all-time highs, a large number of long positions were liquidated at high levels, which was the main reason for the rapid price decline. This is a healthy technical correction, not a trend reversal.
The rebound in the US dollar and US Treasuries: The US dollar index rebounded from a seven-week low, and US Treasury yields rose from a five-month low. This increased the opportunity cost of holding non-interest-bearing gold, exerting short-term pressure on gold prices.
Future Focus: US CPI Data:
This week's focus: All eyes are on the upcoming release of the US August CPI (Consumer Price Index) and PPI (Producer Price Index) data. These data are the most important reference indicators before the Federal Reserve’s September interest rate decision.
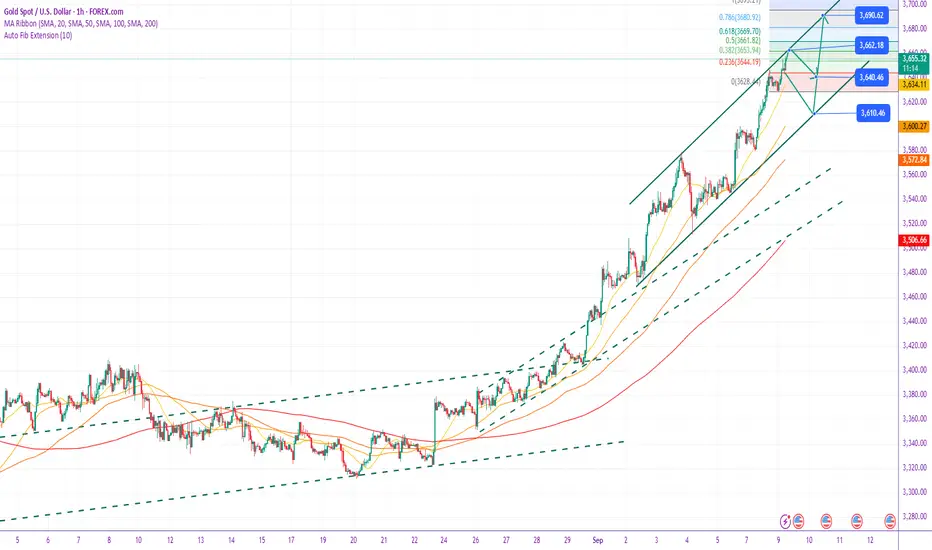
III. In-depth Technical Analysis
Trend Positioning: The daily bullish trend is undeniable. The market closed with a big bullish candlestick last week and continued to be strong at the beginning of this week. All moving average systems are in a bullish arrangement, providing support for prices.
Key Level Analysis:
Upper Resistance:
Short-term Resistance: 3645-3655 (Yesterday's high conversion and psychological barrier)
Core Resistance: 3665-3680 (historical high area)
Ultimate Target: 3700 (major psychological and technical barrier)
Lower Support:
First Support: 3630-3628 (top of yesterday's Asia-Europe trading range, turning into a watershed for intraday strength and weakness)
Second Support: 3610-3600 (psychological barrier and concentrated trading area)
Bull Lifeline: 3580 (last wave starting point & 4-hour top and bottom conversion level). If it falls below this level, it means that this round of strong rise may come to an end, and the market will enter a deeper adjustment or turn bearish.
Trading Strategy and Thinking:
Long Strategy (Buy Low):
Aggressive Buy: When the 3630-3628 support area stabilizes (e.g., a bullish candlestick pattern appears), try a small buy position with a stop-loss below 3620, targeting 3645-3655.
Steady long buy: wait for a pullback to the key support area of 3610-3600 or even 3580 before placing long orders in batches, with the stop loss set below 3570 and the target to return to above 3630. Short-selling strategy (selling at high levels):
Blindly chasing high prices is not recommended at this time. If the price rebounds to the strong resistance area of 3645-3655, try a small short position with a stop-loss above 3665, targeting 3630-3620.
If the gold price unexpectedly falls below the key support of 3628, you can follow the trend and enter a short position, with the target at 3610-3600.
IV. Summary and Today's Trading Recommendations
Overall Strategy: Before the release of major data, the market is likely to remain volatile at high levels. Operators should reduce their positions and set strict stop-loss orders to avoid the risk of sharp fluctuations caused by data fluctuations.
Intraday Short-Term:
Short if the market breaks through the 3645-3655 area, with a stop-loss at 3660 and a target of 3635-3625.
Long if the market retraces below the 3615-3605 area, with a stop-loss at 3598 and a target of 3625-3635.
Trend Following:
Hold the 3580 bullish support level, maintain a bullish outlook above this level, and view all pullbacks as buying opportunities.
If it effectively breaks below 3580, we will need to turn bearish or wait and see, waiting for a new direction to be chosen.
Risk Warning: The above analysis is based on current market information; trading decisions should be considered in conjunction with real-time market conditions. The key focus this week is the US CPI data. It is recommended to liquidate positions or maintain a very light position before the data is released, and then trade accordingly once the data direction becomes clear.
❤️Free gold trading signals:t.me/+7W6lfjoqQ-Y2NjU0
🥇Gold price trend analysis and forecast
💹Technical analysis (K-line patterns, trend lines, indicator systems)
✅Gold's safe-haven properties and asset allocation strategy
🥇Gold price trend analysis and forecast
💹Technical analysis (K-line patterns, trend lines, indicator systems)
✅Gold's safe-haven properties and asset allocation strategy
Penerbitan berkaitan
Penafian
Maklumat dan penerbitan adalah tidak dimaksudkan untuk menjadi, dan tidak membentuk, nasihat untuk kewangan, pelaburan, perdagangan dan jenis-jenis lain atau cadangan yang dibekalkan atau disahkan oleh TradingView. Baca dengan lebih lanjut di Terma Penggunaan.