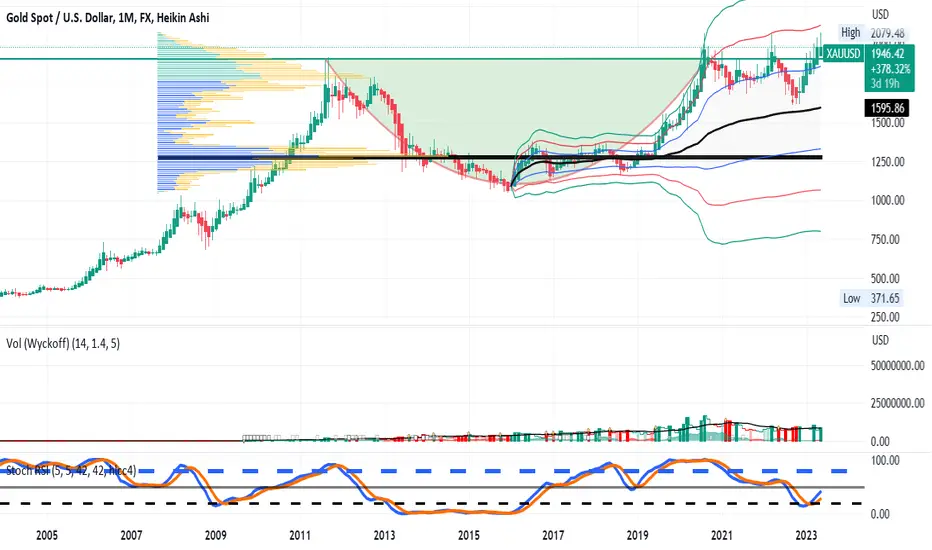
On the monthly chart over the past 12-15 years, XAUUSD appears to have printed a cup and
handle pattern now with the price above the trigger for bullish continuation. Trading volumes
have persistently increased over the years but especially since COVID. Perhaps central banks
are gradually accumulating and hedging the challenges to fiat currency. Since the cup height is
about $ 850 and the width is about ten years, the pattern might predict a gold price rise from
$1950 + $850 = $2800 over a period of half the cup width or five years. Fundamentals
including geopolitical and macroeconomic events trump any technicals. The stochastic RSI
shows spot gold at the lows right now. The long-term volume profile suggests the most trading
volume was at about $1295 over the visible ( POC line) Price being well above that line is
a bullish bias overall. The long-term anchored VWAP originating at the cup base shows gold
price is currently one standard deviation above the mean VWAP band, making it high in the
fair value zone. Gold supply/mining may be fairly linear with increasing production costs
such as labor, energy, and others subject to inflation. Gold demand may be rising as the chart
shows rise rising above the POC line and into higher VWAP bands. The combination of increased
mining costs and gold demand perhaps increasing at more than linear points toward the
the potential of rising prices moving forward.
Penafian
The information and publications are not meant to be, and do not constitute, financial, investment, trading, or other types of advice or recommendations supplied or endorsed by TradingView. Read more in the Terms of Use.
Penafian
The information and publications are not meant to be, and do not constitute, financial, investment, trading, or other types of advice or recommendations supplied or endorsed by TradingView. Read more in the Terms of Use.
