Trading Analysis for Gold Spot / U.S. Dollar (15-Minute Chart)
Based on the provided 15-minute chart for Gold Spot / U.S. Dollar (XAU/USD) and the specified data, here’s a suggested trading setup for a sell position:
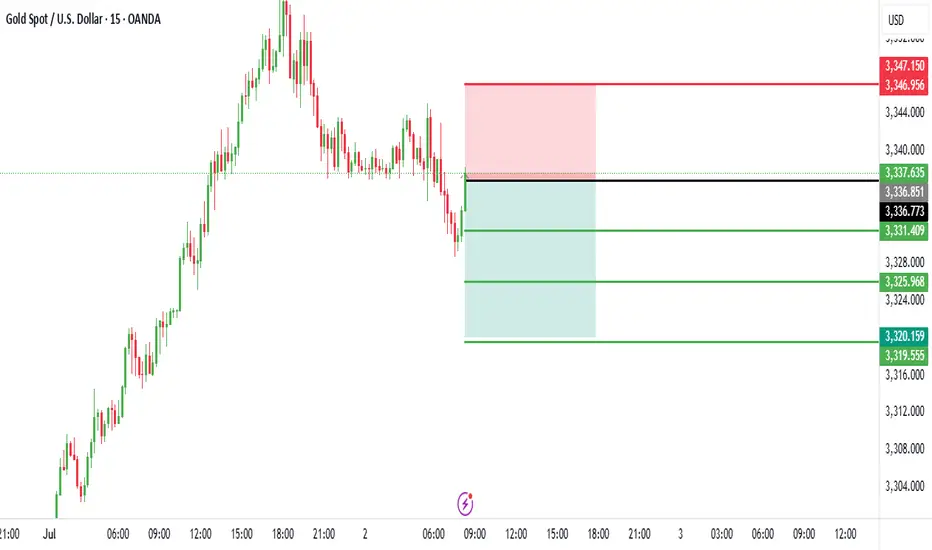
Current Price and Trend: The current price is not explicitly provided, but the entry price is set at 3,336.00. The chart suggests a potential resistance zone near this level, with a recent uptrend showing signs of exhaustion.
Sell Entry: Enter a sell position at 3,336.00, aligning with the specified entry price where the price may face rejection due to resistance.
Stop Loss: Place a stop loss at 3,346.00, above the recent high, to protect against an upward breakout. This level is 10.00 points above the entry, defining the risk.
Take Profit Levels:
Take Profit 1: 3,331.00, a conservative target 5.00 points below the entry.
Take Profit 2: 3,326.00, a mid-range target 10.00 points below the entry.
Take Profit 3: 3,321.00, a deeper target 15.00 points below the entry, aligning with a potential support zone.
Price Action: The chart indicates a peak near the entry level, with a bearish reversal signal suggested by the candlestick pattern and resistance line.
Risk-Reward Ratio: The distance to the stop loss (10.00 points) compared to the take profit levels (5.00 to 15.00 points) offers a mixed risk-reward profile. Take Profit 2 and 3 provide a 1:1 and 1:1.5 ratio, respectively, making this a balanced short-term trade.
Conclusion
Enter a sell at 3,336.00, with a stop loss at 3,346.00 and take profit levels at 3,331.00, 3,326.00, and 3,321.00. Monitor the price action for confirmation of a downtrend, and be cautious of a potential upward move if the price breaks above the stop loss level.
Dagangan aktif
TAKE PROFIT 1 HIT GUYS AND MOVE YOUR STOCK LOSS TO ENTERY.Penafian
The information and publications are not meant to be, and do not constitute, financial, investment, trading, or other types of advice or recommendations supplied or endorsed by TradingView. Read more in the Terms of Use.
Penafian
The information and publications are not meant to be, and do not constitute, financial, investment, trading, or other types of advice or recommendations supplied or endorsed by TradingView. Read more in the Terms of Use.