✅ Gold Analysis from 4-Hour Chart:
Gold reached a high of 4381.40, then pulled back and broke through several support levels, forming a downtrend. The current price is near 4050, which is a key support zone. If gold remains around this level, a rebound may occur.
Moving Averages: MA5 has crossed below MA10, and both MA20 and MA50 show a downtrend, indicating that gold may continue to pull back in the short term. The price is between MA20 and MA50. If gold continues to decline and breaks below the 4050 support, it may further test 4004.38 or 3945 support zones.
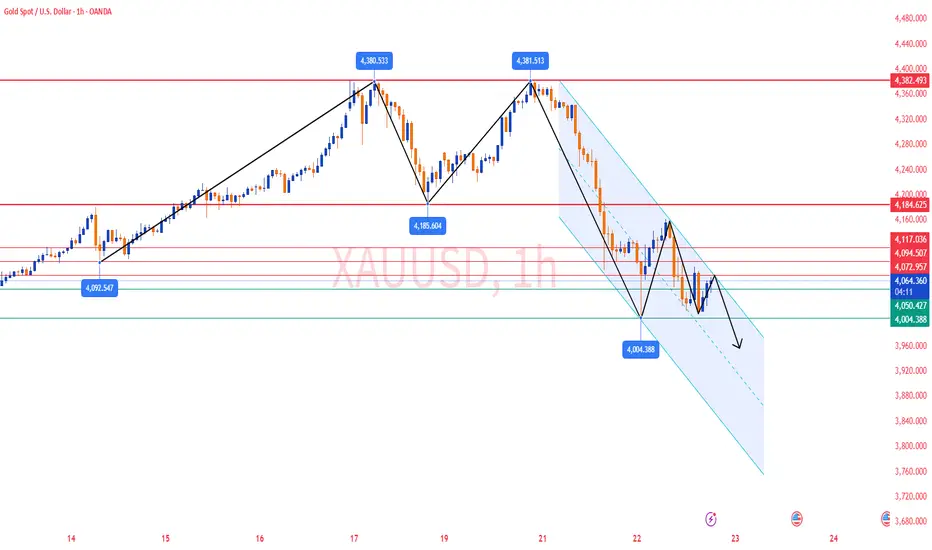
✅ Gold Analysis from 1-Hour Chart:
After forming a double-top pattern, gold quickly pulled back, signaling that gold has entered a correction phase. Currently, gold is oscillating near the support zone, and if the support holds, a rebound could happen.
The price is near the middle band of the Bollinger Bands at 4082.44 and close to the lower band at 3998, suggesting that gold is in a consolidation range and has not broken through key support or resistance levels. If gold breaks below the lower band, it may continue to decline.
🔴 Resistance Levels: 4072 / 4094 / 4117
🟢 Support Levels: 4050 / 4004 / 3995
✅ Trading Strategy Reference:
🔰 If gold fails to break 4072 and falls below 4052, consider going short, targeting 4004-3995.
🔰 If gold breaks 4072 and holds above it, consider going long, targeting 4094-4117.
✅ Gold is currently consolidating in the support zone. If the 4050 support holds, a rebound may occur. However, if the support breaks, it may continue to decline to lower support zones. Monitor the breakout of resistance levels and adjust your strategy accordingly.
Gold reached a high of 4381.40, then pulled back and broke through several support levels, forming a downtrend. The current price is near 4050, which is a key support zone. If gold remains around this level, a rebound may occur.
Moving Averages: MA5 has crossed below MA10, and both MA20 and MA50 show a downtrend, indicating that gold may continue to pull back in the short term. The price is between MA20 and MA50. If gold continues to decline and breaks below the 4050 support, it may further test 4004.38 or 3945 support zones.
✅ Gold Analysis from 1-Hour Chart:
After forming a double-top pattern, gold quickly pulled back, signaling that gold has entered a correction phase. Currently, gold is oscillating near the support zone, and if the support holds, a rebound could happen.
The price is near the middle band of the Bollinger Bands at 4082.44 and close to the lower band at 3998, suggesting that gold is in a consolidation range and has not broken through key support or resistance levels. If gold breaks below the lower band, it may continue to decline.
🔴 Resistance Levels: 4072 / 4094 / 4117
🟢 Support Levels: 4050 / 4004 / 3995
✅ Trading Strategy Reference:
🔰 If gold fails to break 4072 and falls below 4052, consider going short, targeting 4004-3995.
🔰 If gold breaks 4072 and holds above it, consider going long, targeting 4094-4117.
✅ Gold is currently consolidating in the support zone. If the 4050 support holds, a rebound may occur. However, if the support breaks, it may continue to decline to lower support zones. Monitor the breakout of resistance levels and adjust your strategy accordingly.
✅ 𝐃𝐚𝐢𝐥𝐲 𝟐-𝟒 𝐓𝐫𝐚𝐝𝐢𝐧𝐠 𝐒𝐢𝐠𝐧𝐚𝐥𝐬 🔥
✅ 𝐇𝐢𝐠𝐡 𝐀𝐜𝐜𝐮𝐫𝐚𝐜𝐲 𝟗𝟎%-𝟗𝟓% 🔥
✅ 𝐌𝐨𝐧𝐭𝐡𝐥𝐲 𝐏𝐫𝐨𝐟𝐢𝐭 𝟑𝟓𝟎𝟎 𝐏𝐈𝐏𝐒 🔥
💎 𝐏𝐫𝐨𝐟𝐞𝐬𝐬𝐢𝐨𝐧𝐚𝐥 𝐂𝐡𝐚𝐧𝐧𝐞𝐥:t.me/+LzcpwzbV2hcwZDZl
✅ 𝐇𝐢𝐠𝐡 𝐀𝐜𝐜𝐮𝐫𝐚𝐜𝐲 𝟗𝟎%-𝟗𝟓% 🔥
✅ 𝐌𝐨𝐧𝐭𝐡𝐥𝐲 𝐏𝐫𝐨𝐟𝐢𝐭 𝟑𝟓𝟎𝟎 𝐏𝐈𝐏𝐒 🔥
💎 𝐏𝐫𝐨𝐟𝐞𝐬𝐬𝐢𝐨𝐧𝐚𝐥 𝐂𝐡𝐚𝐧𝐧𝐞𝐥:t.me/+LzcpwzbV2hcwZDZl
Penafian
Maklumat dan penerbitan adalah tidak dimaksudkan untuk menjadi, dan tidak membentuk, nasihat untuk kewangan, pelaburan, perdagangan dan jenis-jenis lain atau cadangan yang dibekalkan atau disahkan oleh TradingView. Baca dengan lebih lanjut di Terma Penggunaan.