Latest Gold Trend Analysis and Strategy for August 25th:
I. Analysis of Core Market Drivers
Reason for the Recent Surge: Gold prices surged sharply on Friday (August 22nd), reaching a high of 3,377, primarily due to the convergence of three factors:
Rising expectations of rate cuts: The market is betting that the Federal Reserve will begin its rate cut cycle early.
Concerns about economic risks: Risk aversion boosts gold's appeal.
Weaker US dollar: The US dollar index fell, supporting dollar-denominated gold.
Underlying Logic: The market believes the Federal Reserve's policy focus has shifted from "fighting inflation first" to "balancing employment and inflation." This expectation is priced in by the market in advance and reflected in the gold price.
Future Focus: Whether the upward trend can continue depends entirely on whether the "rate cut expectations" are confirmed by economic data.
Key Focus:
August Non-Farm Payrolls (NFP)
August Consumer Price Index (CPI)
September Federal Reserve meeting: These three events will determine the medium- and long-term direction of gold.
II. Technical Analysis: Bullish and Bearish Perspectives
Medium- to Long-Term Perspective (Bearish):
View: The monthly chart shows consecutive doji candlestick formations, indicating a fierce battle between bulls and bears at high levels. We maintain the view that "every upward move is a preparation for a larger decline in the future."
Bearish Target Path:
Short-Term Target: Target the 3330 → 3315 → 3300 → 3270 support areas.
Ultimate Target: After breaking below 3245, target the 3150-3120 area, or even the 3000-2950 range.
Short-Term Perspective (Key Decision Points):
Current Situation: Gold prices are at a critical crossroads. The market is deciding whether the next step will be a "short-term rebound followed by a decline" or a "direct break below key support."
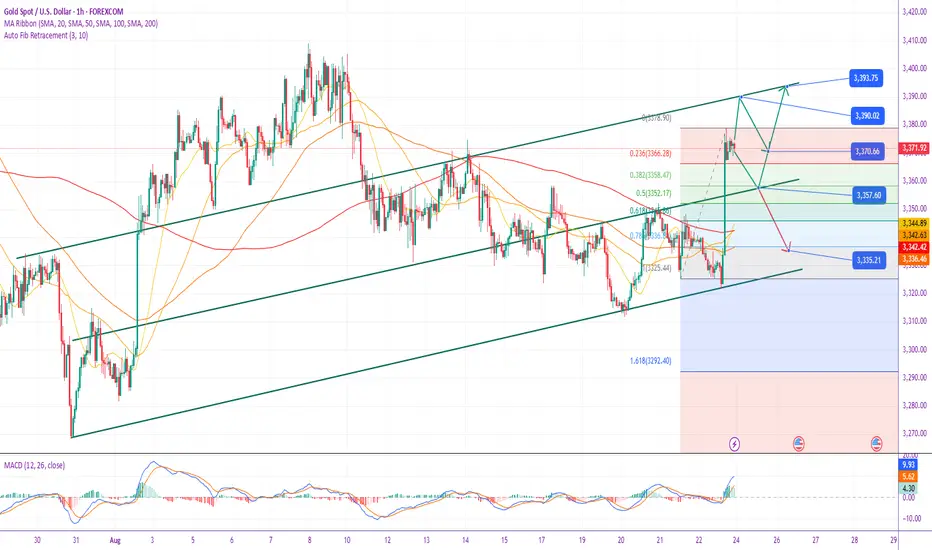
Key Support Zone: 3325-3320 represents the recent strength-weakness dividing line, with strong support at 3315 below.
Friday's Verification: Gold prices successfully tested 3325 support and then staged a strong V-shaped reversal, breaking through the previous high. This initially confirms the validity of this support area and indicates a shift in short-term momentum from bearish to bullish.
III. Specific Trading Strategy
Based on the strong technical rebound and breakout of the key support level, the following short-term long strategy is formulated:
Trading Direction: Short-term long on dips
Ideal Entry Area: 3352-3348
Stop-Loss: 3345 (If the price falls back and effectively breaks below this level, the breakout has failed, and long positions should be exited immediately.)
Target Prices:
First Target: 3360-3365
Second Target: 3374 (near the previous high)
Third Target: 3385
IV. Risk Warning
This strategy is based on current market news and technical analysis. The medium- to long-term bearish trend remains unchanged. This is primarily a short-term rebound strategy.
Please closely monitor the three major risk events mentioned above (non-farm payrolls, CPI, and the Federal Reserve meeting). Any unexpected data could reverse market sentiment and invalidate the strategy. Position management is crucial. Be sure to keep a light position and set a strict stop-loss.
Dagangan aktif
📊 Latest Gold Trend Analysis Strategy (August 25, 2025):
I. Fundamental Analysis
Federal Reserve Policy Expectations
Powell's dovish speech at Jackson Hole eased market concerns about inflation and reinforced expectations for a September rate cut.
CME FedWatch data shows the probability of a 25 basis point rate cut in September has increased from 75% to 85%, with the cumulative rate cuts by year-end increasing from 48 basis points to 54 basis points.
If subsequent employment and inflation data continue to weaken, the Fed may further increase its easing efforts.
The US Dollar and Gold Linkage
The US dollar index plummeted 0.96% to 97.66 points last Friday, and a weak dollar has increased gold's appeal.
Market expectations have already seen gold as a safe-haven asset and investment asset in the context of monetary easing.
Market Sentiment and Risks
Investors' confidence in the gold outlook has increased, and Wall Street analysts are generally bullish.
Short-term caution: Volatile US employment and inflation data and geopolitical risks (such as Trump's pressure on the Fed).
II. Technical Analysis
Daily Chart
Last Friday, gold prices bottomed out and rebounded above the 3350 level, forming signs of a V-shaped reversal.
The technical pattern shifted from a "volatile decline" to a "rebound up."
4-Hour Chart
Support: 3345-3350 (previously a key resistance level, now turning support).
Resistance: 3385-3400 (a key round number, crucial for the continuation of the bull market).
Hourly Chart
A golden cross of the moving averages indicates a bullish trend, and short-term upward momentum remains.
The absence of a rapid rise and fall from the highs suggests that the bulls have stabilized.
III. Trading Strategy (Primarily Short-Term)
Main Strategy: Buy on pullbacks as the primary trading strategy, with shorting on rebounds as a supplementary strategy.
✅ Buy-to-Long Range: Around 3350-3345, with a stop-loss below 3340.
🎯 Bullish Target: Initially focus on 3380-3390. A break above 3400 opens up further potential.
Counter-trading strategy: Short sell at high levels
❌ Shorting range: Expect a small position when pressure is seen around 3385-3400, with a stop-loss above 3405.
🎯 Short target: Target the 3350 support level.
📌 Summary:
Gold has rebounded strongly from last week's downturn, with Powell's speech becoming a turning point. Short-term support at 3350 is key. If it holds, the bullish trend is expected to continue, and a break above 3400 will open up further upside potential. The strategy is primarily to buy on dips, supplemented by cautious shorting at high levels.
Penerbitan berkaitan
Penafian
Maklumat dan penerbitan adalah tidak dimaksudkan untuk menjadi, dan tidak membentuk, nasihat untuk kewangan, pelaburan, perdagangan dan jenis-jenis lain atau cadangan yang dibekalkan atau disahkan oleh TradingView. Baca dengan lebih lanjut di Terma Penggunaan.
Penerbitan berkaitan
Penafian
Maklumat dan penerbitan adalah tidak dimaksudkan untuk menjadi, dan tidak membentuk, nasihat untuk kewangan, pelaburan, perdagangan dan jenis-jenis lain atau cadangan yang dibekalkan atau disahkan oleh TradingView. Baca dengan lebih lanjut di Terma Penggunaan.