✅ On the daily chart, gold has shown signs of stabilization after consecutive declines, with support forming in the 3310–3320 range. After rebounding, it is currently capped by resistance around 3350–3360, keeping the price in a consolidation phase. Short-term moving averages (MA5/MA10) are flattening, suggesting weakening bearish momentum; however, the medium-term MA20 is still trending downward, indicating that a full trend reversal has not yet been confirmed.
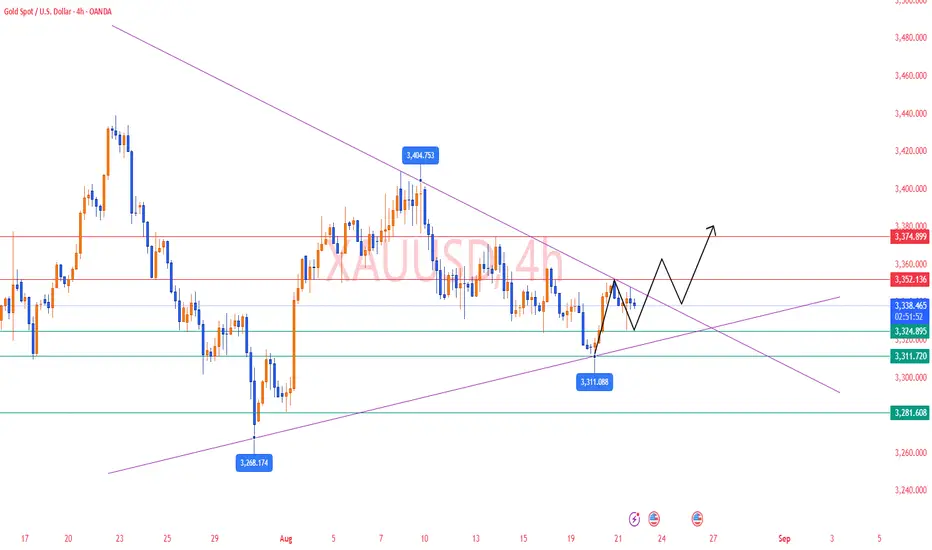
✅ On the 4-hour chart, gold rebounded after bottoming out near 3311, reaching as high as 3352, and is now consolidating around 3340. Price action is hovering near the middle Bollinger Band, with narrowing bands signaling a short-term sideways pattern. The short-term trend remains mildly bullish; a breakout above 3350–3355 could pave the way for 3365–3375, while a drop below 3330 may signal renewed weakness.
✅ On the 1-hour chart, the price has been oscillating between 3337–3345, repeatedly testing upper resistance without a clear breakout. The MA5 and MA10 have converged multiple times, reflecting indecision and a lack of clear short-term direction. If the price fails to break above 3348–3352, it may retreat to test the 3330–3325 support area.
🔴 Resistance Levels: 3350–3355 / 3365–3375
🟢 Support Levels: 3330–3325 / 3310–3295
✅ Trading Strategy Reference:
🔰 If gold approaches the 3350–3355 resistance, consider light short positions, targeting 3335–3330. A confirmed break below 3330 could open the way toward 3310.
🔰 If the price pulls back and holds in the 3330–3325 area, consider entering long positions, targeting 3350–3360. A breakout above 3360 could extend gains toward 3375–3380.
🔥Trading Reminder: Trading strategies are time-sensitive, and market conditions can change rapidly. Please adjust your trading plan based on real-time market conditions🤝
✅𝐃𝐚𝐢𝐥𝐲 𝟐-𝟒 𝐓𝐫𝐚𝐝𝐢𝐧𝐠 𝐒𝐢𝐠𝐧𝐚𝐥𝐬🔥
✅𝐇𝐢𝐠𝐡 𝐀𝐜𝐜𝐮𝐫𝐚𝐜𝐲 𝟗𝟎%-𝟗𝟓% 🔥
✅𝐖𝐞𝐞𝐤𝐥𝐲 𝐲𝐢𝐞𝐥𝐝 𝟔𝟎%-𝟖𝟓%🔥
👉Free Channel:t.me/+AMHhMKEIj_IzN2Vl
✉️VIP Guidance : t.me/Jack_blackwell
✅𝐇𝐢𝐠𝐡 𝐀𝐜𝐜𝐮𝐫𝐚𝐜𝐲 𝟗𝟎%-𝟗𝟓% 🔥
✅𝐖𝐞𝐞𝐤𝐥𝐲 𝐲𝐢𝐞𝐥𝐝 𝟔𝟎%-𝟖𝟓%🔥
👉Free Channel:t.me/+AMHhMKEIj_IzN2Vl
✉️VIP Guidance : t.me/Jack_blackwell
Penafian
Maklumat dan penerbitan adalah tidak dimaksudkan untuk menjadi, dan tidak membentuk, nasihat untuk kewangan, pelaburan, perdagangan dan jenis-jenis lain atau cadangan yang dibekalkan atau disahkan oleh TradingView. Baca dengan lebih lanjut di Terma Penggunaan.