✅ 4H Chart (H4) Trend Analysis
1️⃣ Clear high-level consolidation on H4
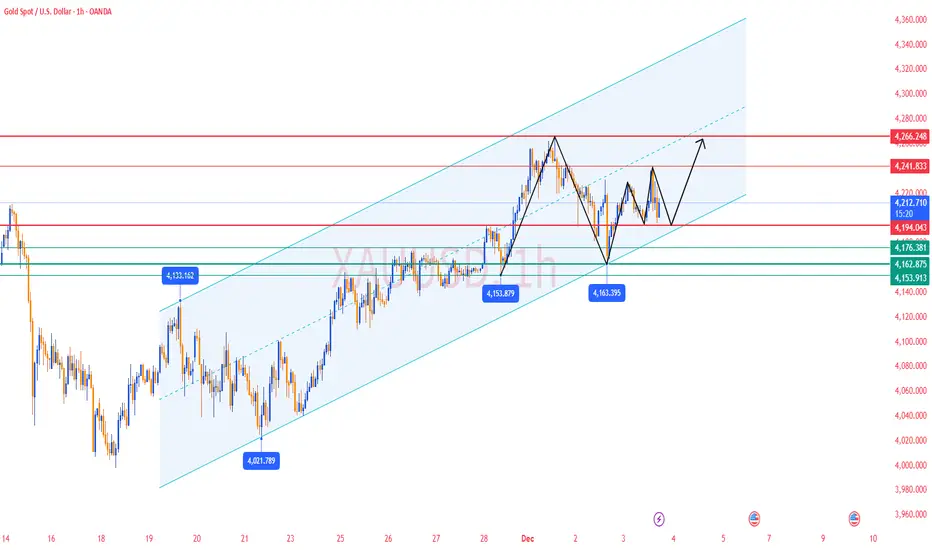
During today’s U.S. session, gold surged to 4241.55, then pulled back quickly.
It failed to break the previous high 4264, indicating weakening bullish momentum.
The decline touched 4195, then rebounded strongly, showing solid institutional buying below, a typical high-level sideways + two-way washout phase.
2️⃣ Bollinger Bands Structure:
Middle band (≈4204–4206) is now the key support & bull-bear divider.
Upper band near 4256 was approached but not broken → strong resistance remains.
Lower band at 4181 has held multiple times → short-term bottom strengthening.
➡️ As long as H4 holds above the middle band 4204, gold maintains a bullish bias.
✅ 1H Chart (H1) Trend Analysis
1️⃣ Sharp rise → sharp drop → secondary rebound pattern
Gold was rejected at 4241, dropped straight to 4195 → bearish pressure released.
Then it quickly rebounded to 4210 → short-term bulls are fighting back.
This is a classic “stop-hunt spike → bottoming rebound” structure, not a bearish reversal.
2️⃣ Bollinger Bands (H1)
▪ Lower band (≈4194) successfully supported the price → valid support
▪ Middle band (≈4212) is the first resistance for short-term bulls
▪ Upper band (≈4230–4235) remains strong resistance
🔴 Resistance Levels:
▪ 4215–4220 (H1 MA20 + H4 moving-average cluster)
▪ 4230–4234 (H1 Bollinger upper band)
▪ 4250–4256 (H4 upper band + major resistance area)
🟢 Support Levels:
▪ 4195–4188 (strong U.S. session demand zone)
▪ 4185–4175 (key support; break = bearish)
▪ 4163 (confirmed swing low)
✅ Trading Strategy Reference
🔰 Main Strategy: Buy on Dips (short-term bullish bias)
🟠 First Buy Zone: 4195–4188
🎯 Targets: 4215 / 4230
⛔ Stop-loss: below 4178
🟠 Second Buy Zone: 4185–4175
🎯 Targets: 4230 / 4250
⛔ Stop-loss: below 4168
🔰 Secondary Strategy: Short on Rejections (short-term only)
🟠 First Sell Zone: 4215–4220
Enter light shorts if ANY of the following appear:
▪ Long upper wick
▪ Bearish 1H candle
▪ Weak breakout with low volume
🎯 Targets: 4195 / 4185
⛔ Stop-loss: above 4228
🟠 Second Sell Zone: 4230–4250 (major resistance zone)
🎯 Targets: 4195 / 4185
⛔ Stop-loss: above 4265
📌 Trend Summary
1️⃣ Today’s high 4241.55 = major resistance confirmed
2️⃣ Strong rebound after dropping to 4195–4188 → buyers active
3️⃣ Short-term structure = range-bound but bullish-tilted
4️⃣ 4215–4220 is the key breakout zone
5️⃣ Break above 4220 → targets 4234 / 4250
6️⃣ Break below 4175 → retest 4163
7️⃣ Medium-term bullish structure remains solid; current move is strong consolidation correction
🔥Trading Reminder: Trading strategies are time-sensitive, and market conditions can change rapidly. Please adjust your trading plan based on real-time market conditions.
1️⃣ Clear high-level consolidation on H4
During today’s U.S. session, gold surged to 4241.55, then pulled back quickly.
It failed to break the previous high 4264, indicating weakening bullish momentum.
The decline touched 4195, then rebounded strongly, showing solid institutional buying below, a typical high-level sideways + two-way washout phase.
2️⃣ Bollinger Bands Structure:
Middle band (≈4204–4206) is now the key support & bull-bear divider.
Upper band near 4256 was approached but not broken → strong resistance remains.
Lower band at 4181 has held multiple times → short-term bottom strengthening.
➡️ As long as H4 holds above the middle band 4204, gold maintains a bullish bias.
✅ 1H Chart (H1) Trend Analysis
1️⃣ Sharp rise → sharp drop → secondary rebound pattern
Gold was rejected at 4241, dropped straight to 4195 → bearish pressure released.
Then it quickly rebounded to 4210 → short-term bulls are fighting back.
This is a classic “stop-hunt spike → bottoming rebound” structure, not a bearish reversal.
2️⃣ Bollinger Bands (H1)
▪ Lower band (≈4194) successfully supported the price → valid support
▪ Middle band (≈4212) is the first resistance for short-term bulls
▪ Upper band (≈4230–4235) remains strong resistance
🔴 Resistance Levels:
▪ 4215–4220 (H1 MA20 + H4 moving-average cluster)
▪ 4230–4234 (H1 Bollinger upper band)
▪ 4250–4256 (H4 upper band + major resistance area)
🟢 Support Levels:
▪ 4195–4188 (strong U.S. session demand zone)
▪ 4185–4175 (key support; break = bearish)
▪ 4163 (confirmed swing low)
✅ Trading Strategy Reference
🔰 Main Strategy: Buy on Dips (short-term bullish bias)
🟠 First Buy Zone: 4195–4188
🎯 Targets: 4215 / 4230
⛔ Stop-loss: below 4178
🟠 Second Buy Zone: 4185–4175
🎯 Targets: 4230 / 4250
⛔ Stop-loss: below 4168
🔰 Secondary Strategy: Short on Rejections (short-term only)
🟠 First Sell Zone: 4215–4220
Enter light shorts if ANY of the following appear:
▪ Long upper wick
▪ Bearish 1H candle
▪ Weak breakout with low volume
🎯 Targets: 4195 / 4185
⛔ Stop-loss: above 4228
🟠 Second Sell Zone: 4230–4250 (major resistance zone)
🎯 Targets: 4195 / 4185
⛔ Stop-loss: above 4265
📌 Trend Summary
1️⃣ Today’s high 4241.55 = major resistance confirmed
2️⃣ Strong rebound after dropping to 4195–4188 → buyers active
3️⃣ Short-term structure = range-bound but bullish-tilted
4️⃣ 4215–4220 is the key breakout zone
5️⃣ Break above 4220 → targets 4234 / 4250
6️⃣ Break below 4175 → retest 4163
7️⃣ Medium-term bullish structure remains solid; current move is strong consolidation correction
🔥Trading Reminder: Trading strategies are time-sensitive, and market conditions can change rapidly. Please adjust your trading plan based on real-time market conditions.
✅ 𝐃𝐚𝐢𝐥𝐲 𝟐-𝟒 𝐓𝐫𝐚𝐝𝐢𝐧𝐠 𝐒𝐢𝐠𝐧𝐚𝐥𝐬 🔥
✅ 𝐇𝐢𝐠𝐡 𝐀𝐜𝐜𝐮𝐫𝐚𝐜𝐲 𝟗𝟎%-𝟗𝟓% 🔥
✅ 𝐌𝐨𝐧𝐭𝐡𝐥𝐲 𝐏𝐫𝐨𝐟𝐢𝐭 𝟑𝟓𝟎𝟎 𝐏𝐈𝐏𝐒 🔥
💎 𝐏𝐫𝐨𝐟𝐞𝐬𝐬𝐢𝐨𝐧𝐚𝐥 𝐅𝐫𝐞𝐞 𝐆𝐫𝐨𝐮𝐩:t.me/+YgFaky2XQ7ViYWE9
✅ 𝐇𝐢𝐠𝐡 𝐀𝐜𝐜𝐮𝐫𝐚𝐜𝐲 𝟗𝟎%-𝟗𝟓% 🔥
✅ 𝐌𝐨𝐧𝐭𝐡𝐥𝐲 𝐏𝐫𝐨𝐟𝐢𝐭 𝟑𝟓𝟎𝟎 𝐏𝐈𝐏𝐒 🔥
💎 𝐏𝐫𝐨𝐟𝐞𝐬𝐬𝐢𝐨𝐧𝐚𝐥 𝐅𝐫𝐞𝐞 𝐆𝐫𝐨𝐮𝐩:t.me/+YgFaky2XQ7ViYWE9
Penafian
Maklumat dan penerbitan adalah tidak bertujuan, dan tidak membentuk, nasihat atau cadangan kewangan, pelaburan, dagangan atau jenis lain yang diberikan atau disahkan oleh TradingView. Baca lebih dalam Terma Penggunaan.