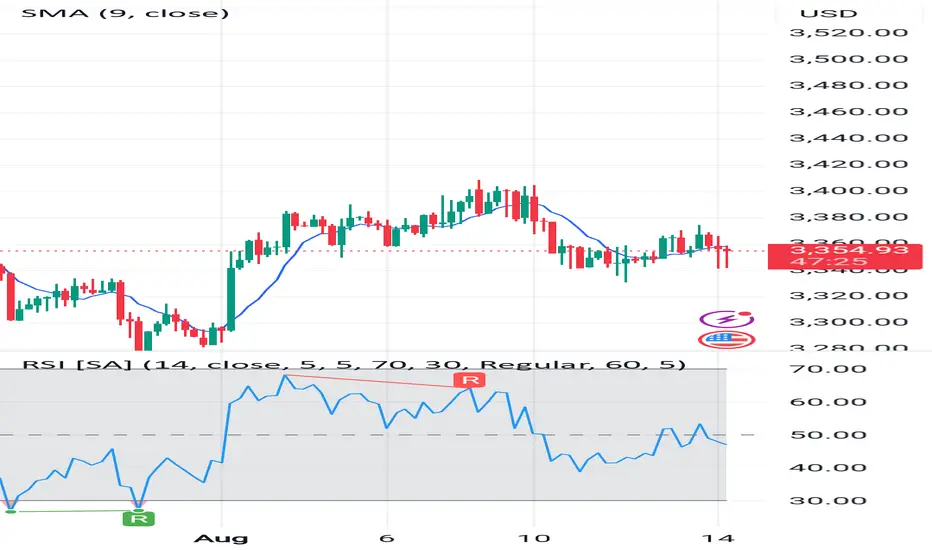
Current Market Price
Sell Price: 3,354.08
Buy Price: 3,354.29
Very tight spread, indicating high liquidity.
Indicators Used
SMA (9-period) – Price is currently below the SMA, suggesting short-term bearish momentum.
RSI (14) – Currently around ~50, indicating a neutral zone (neither overbought nor oversold).
Recent RSI Trend – It recently dropped from ~65 to ~45, showing weakening buying pressure.
Price Action
Recent price movement shows:
A sharp drop from ~3,400 to ~3,325.
A small recovery attempt, but failing to break above SMA 9, showing sellers are still in control.
Candlestick patterns show lower highs and lower lows, a classic bearish sign.
Support & Resistance Levels
Immediate Resistance: ~3,375 (SMA 9 area & recent rejection zone).
Immediate Support: ~3,325 (recent bounce area).
Major Resistance: ~3,400
Major Support: ~3,300
Signal
Trend Bias: Bearish in short term.
Momentum: Weak buying strength, sellers still dominant.
Recommendation: SELL
Entry: Around 3,354–3,360 (current price zone).
Stop Loss: Above 3,375 (above SMA & last swing high).
Take Profit 1: 3,325 (near-term support).
Take Profit 2: 3,300 (major support zone).
Risk Management
Risk–Reward ratio target: at least 1:2.
Avoid over-leverage; gold can move fast on news.
📌 Summary:
The market shows weakness after a failed recovery. Price staying below SMA 9 and RSI losing momentum indicates sellers are in control. Unless price breaks above 3,375 with strong volume, the bias remains short-term bearish.
Penafian
Maklumat dan penerbitan adalah tidak dimaksudkan untuk menjadi, dan tidak membentuk, nasihat untuk kewangan, pelaburan, perdagangan dan jenis-jenis lain atau cadangan yang dibekalkan atau disahkan oleh TradingView. Baca dengan lebih lanjut di Terma Penggunaan.
Penafian
Maklumat dan penerbitan adalah tidak dimaksudkan untuk menjadi, dan tidak membentuk, nasihat untuk kewangan, pelaburan, perdagangan dan jenis-jenis lain atau cadangan yang dibekalkan atau disahkan oleh TradingView. Baca dengan lebih lanjut di Terma Penggunaan.
