August 14th Gold Analysis
Current Price Dynamics
Spot gold surged and then retreated, hitting a three-day high of $3,375/oz before encountering selling pressure. It is currently trading around $3,345, essentially unchanged from the previous day's closing price. Gold prices are caught in a short-term tug-of-war between bulls and bears: on the one hand, rising global risk sentiment is suppressing safe-haven demand; on the other, growing expectations of a Fed rate cut are providing key support.
I. Analysis of Core Drivers
1. Risk Appetite Suppresses Gold Prices
Optimistic expectations regarding two major geopolitical developments have significantly boosted risk assets:
- Expectations of a three-month extension of the US-China trade truce continue to build;
- The US-Russia summit (August 15th) could potentially help resolve the Russia-Ukraine conflict.
This has pushed the S&P 500 and Nasdaq indices to consecutive record highs, weakening gold's safe-haven appeal.
2. Fed policy expectations dominate bullish sentiment.
- The probability of a September rate cut is approaching 100%: The CME FedWatch tool shows that the market is betting on a 25 basis point rate cut in September, with the possibility of two cumulative rate cuts by the end of the year.
- Policy divergence is intensifying:
- Treasury Secretary Bensont called for a 50 basis point rate cut next month;
- Chicago Fed President Goolsbee expressed concerns about core inflation and hinted against a September action;
- Atlanta Fed President Raphael Bostic acknowledged weak employment but avoided a rate cut stance.
- The US dollar index fell to a two-week low under pressure, while US Treasury yields fell (10-year Treasury yield at 4.23%), further reducing the cost of holding gold.
3. Mixed technical signals:
- Positive signals:
- Successfully holding above the 200-period moving average on the 4-hour chart ($3343-3342);
- Breaking through the $3358-3360 resistance zone confirms a short-term bottoming structure.
- Hidden concerns emerge:
- Hourly and daily oscillators lack upward momentum;
- $3,375 forms a high point of resistance, suppressing any potential rebound.
II. Key Technical Levels and Path Analysis
Key Resistance Areas
1. $3,375 (intraday high) → A breakout would target the psychologically important $3,400 level;
2. $3,409-3,410 (last week's high) → A breakout would open up the intermediate resistance level of $3,422-3,423;
3. $3,434-3,435 → The ultimate target is the historical peak of $3,500.
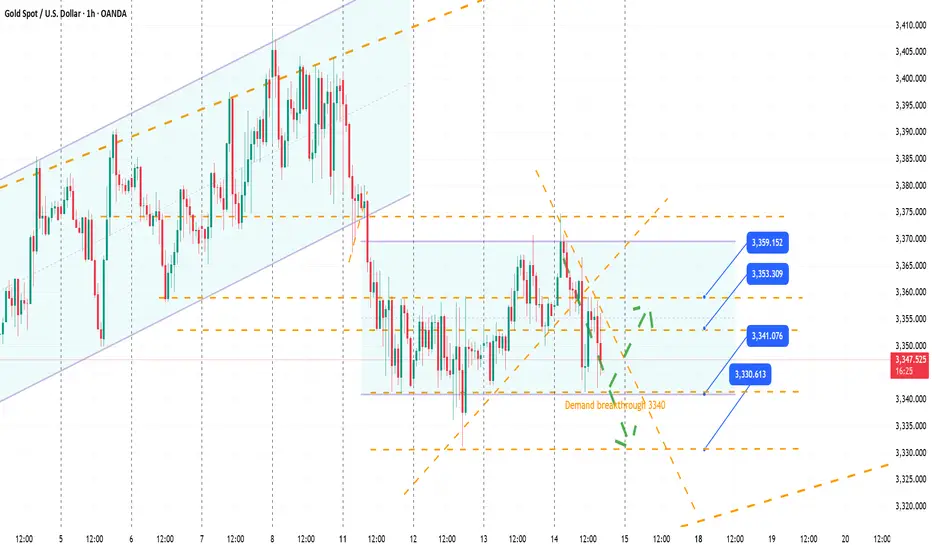
Core Support Bands
1. $3343-3342 (200-period moving average on the 4-hour chart) → Short-term bullish-bearish watershed;
2. $3331 (this week's low) → A break below could trigger a decline towards $3300;
3. A break below $3300 would reverse the short-term technical structure to bearish.
III. Trading Strategy
Long Opportunity
- Entry Conditions: Gold price stabilizes at $3350 and the hourly MACD shows strong volume;
- Tactical Strategy: Build positions in batches within the 3345-3355 range, with a stop-loss below $3340;
- Target Level: $3375 → $3400 → $3422 (gradually reduce positions).
Short Strategy
- Trigger Scenario: Risk sentiment continues to rise;
- Reverse Signal: If the price falls below $3340, try shorting with a small position, with a stop-loss above $3355;
- Target Range: $3331 → $3310 → $3300.
Breakout Trend Following
- If the price breaks through $3380 on high volume, buy above $3400;
- If the price falls below $3330 with a long bearish trend, follow the trend and place a short position with a target below $3300.
Trade with caution and manage risk! Wish you good luck!
Current Price Dynamics
Spot gold surged and then retreated, hitting a three-day high of $3,375/oz before encountering selling pressure. It is currently trading around $3,345, essentially unchanged from the previous day's closing price. Gold prices are caught in a short-term tug-of-war between bulls and bears: on the one hand, rising global risk sentiment is suppressing safe-haven demand; on the other, growing expectations of a Fed rate cut are providing key support.
I. Analysis of Core Drivers
1. Risk Appetite Suppresses Gold Prices
Optimistic expectations regarding two major geopolitical developments have significantly boosted risk assets:
- Expectations of a three-month extension of the US-China trade truce continue to build;
- The US-Russia summit (August 15th) could potentially help resolve the Russia-Ukraine conflict.
This has pushed the S&P 500 and Nasdaq indices to consecutive record highs, weakening gold's safe-haven appeal.
2. Fed policy expectations dominate bullish sentiment.
- The probability of a September rate cut is approaching 100%: The CME FedWatch tool shows that the market is betting on a 25 basis point rate cut in September, with the possibility of two cumulative rate cuts by the end of the year.
- Policy divergence is intensifying:
- Treasury Secretary Bensont called for a 50 basis point rate cut next month;
- Chicago Fed President Goolsbee expressed concerns about core inflation and hinted against a September action;
- Atlanta Fed President Raphael Bostic acknowledged weak employment but avoided a rate cut stance.
- The US dollar index fell to a two-week low under pressure, while US Treasury yields fell (10-year Treasury yield at 4.23%), further reducing the cost of holding gold.
3. Mixed technical signals:
- Positive signals:
- Successfully holding above the 200-period moving average on the 4-hour chart ($3343-3342);
- Breaking through the $3358-3360 resistance zone confirms a short-term bottoming structure.
- Hidden concerns emerge:
- Hourly and daily oscillators lack upward momentum;
- $3,375 forms a high point of resistance, suppressing any potential rebound.
II. Key Technical Levels and Path Analysis
Key Resistance Areas
1. $3,375 (intraday high) → A breakout would target the psychologically important $3,400 level;
2. $3,409-3,410 (last week's high) → A breakout would open up the intermediate resistance level of $3,422-3,423;
3. $3,434-3,435 → The ultimate target is the historical peak of $3,500.
Core Support Bands
1. $3343-3342 (200-period moving average on the 4-hour chart) → Short-term bullish-bearish watershed;
2. $3331 (this week's low) → A break below could trigger a decline towards $3300;
3. A break below $3300 would reverse the short-term technical structure to bearish.
III. Trading Strategy
Long Opportunity
- Entry Conditions: Gold price stabilizes at $3350 and the hourly MACD shows strong volume;
- Tactical Strategy: Build positions in batches within the 3345-3355 range, with a stop-loss below $3340;
- Target Level: $3375 → $3400 → $3422 (gradually reduce positions).
Short Strategy
- Trigger Scenario: Risk sentiment continues to rise;
- Reverse Signal: If the price falls below $3340, try shorting with a small position, with a stop-loss above $3355;
- Target Range: $3331 → $3310 → $3300.
Breakout Trend Following
- If the price breaks through $3380 on high volume, buy above $3400;
- If the price falls below $3330 with a long bearish trend, follow the trend and place a short position with a target below $3300.
Trade with caution and manage risk! Wish you good luck!
Penafian
Maklumat dan penerbitan adalah tidak dimaksudkan untuk menjadi, dan tidak membentuk, nasihat untuk kewangan, pelaburan, perdagangan dan jenis-jenis lain atau cadangan yang dibekalkan atau disahkan oleh TradingView. Baca dengan lebih lanjut di Terma Penggunaan.
Penafian
Maklumat dan penerbitan adalah tidak dimaksudkan untuk menjadi, dan tidak membentuk, nasihat untuk kewangan, pelaburan, perdagangan dan jenis-jenis lain atau cadangan yang dibekalkan atau disahkan oleh TradingView. Baca dengan lebih lanjut di Terma Penggunaan.