Latest Gold Forecast and Analysis for September 15th:
I. Core Viewpoint
The gold market is expected to remain volatile and relatively strong at high levels next week (especially before the Federal Reserve's interest rate decision). The bullish trend remains intact, but there is a risk of a short-term technical correction. The market's focus will be entirely on the Fed's interest rate decision and subsequent policy guidance, which may determine whether gold prices reach new highs or experience a deep correction.
II. Fundamental Analysis
Expectations of a Strengthened Rate Cut (Major Bullish Factor):
Core Driver: Recent US economic data, particularly labor market data (a sharp increase in initial jobless claims, weak non-farm payroll data, and downward revisions to historical employment data), have reinforced market expectations that the Fed is about to begin a cycle of rate cuts.
Market Logic: Expectations of a rate cut have led to a weakening US dollar and lower US Treasury yields, reducing the opportunity cost of holding non-interest-bearing gold and significantly boosting its appeal. This is the fundamental reason that has driven gold prices higher for four consecutive weeks and reached a new record high.
Next Week's Key Event: The Fed's Interest Rate Decision (Key Uncertainty):
The market has largely priced in the expectation of a "first rate cut" next week. The key to the decision lies not in whether or not to cut interest rates, but in the Fed's "dot plot" and Summary of Economic Projections (SEP).
Potentially bullish scenario: If the Fed sends clear dovish signals (such as confirming a path of multiple rate cuts this year), gold prices could surge directly and break through all-time highs.
Potentially bearish scenario: If the Fed takes a hawkish stance (such as expressing concerns about inflation, suggesting a slower pace of rate cuts), this could lead to a "realization of expectations, exhaustion of positive news" market, triggering large-scale profit-taking and a deep correction in gold prices.
III. Technical Analysis
Daily Chart - Bullish Trend
Bull market intact: Gold prices are trading above all major moving averages (MAs), and the MAs are in a perfect bullish alignment, providing strong trend support.
Key Support: The $3,600 mark has transformed from resistance to key support. Further support lies in the $3,550-3,530 area (near the MA20 level and the previous consolidation zone).
Target and Risk: Technical patterns support a move to higher prices, but be wary of news-driven reversals.
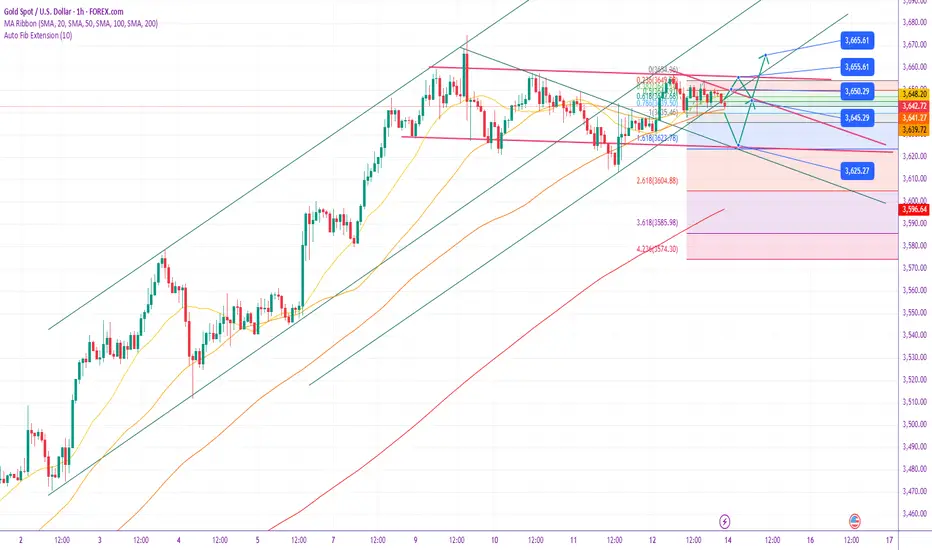
4-Hour Chart - Beware of a short-term pullback risk.
Divergence Signal: The MACD indicator may form a death cross, a warning sign that upward momentum is weakening and diverging from the record high, suggesting a need for a short-term technical correction.
Short-Term Support: The 3630-3625 area is the first key line of defense for bulls in the near term. If broken, a further pullback to the 3600-3580 area (the intersection of the 4-hour MA60 and the daily MA5) is possible.
Short-Term Resistance: The 3655-3660 area is immediate resistance, while the historical high of 3674 is a strong psychological resistance level.
IV. Trading Strategy Recommendations
Overall Approach: Ahead of the Fed's decision, the market may be cautious, with high-level fluctuations prevalent. In terms of operation, you should be cautious in chasing high prices, mainly arrange long orders after a pullback, and try shorting with a light position at key resistance levels.
Long Strategy (Long on Dips):
Ideal Long Zone: After a pullback to the 3630-3625 support range and stabilization, consider a light long position.
Conservative Long Zone: If the pullback deepens, look for dip buying opportunities in the 3600-3580 range.
Target: Target 3650 or 3660. After a breakout, hold and pursue new highs.
Stop-Loss: Place $6-8$ below the entry level.
Short Strategy (Short on Highs):
Opportunities: If the rebound to the 3655-3660 resistance range stagnates, or if the price retests the historical highs of 3670-3674 and fails to break through, consider a light short position.
Target: Target 3640 or 3630.
Stop-Loss: Place above 3675.
Note: This strategy is intended only for technical pullbacks and is a short-term contrarian trade. Maintain a light position and maintain a strict stop-loss.
5. Key Risk Warnings
Federal Reserve Decision Risk: This is the biggest source of uncertainty next week and could trigger significant market volatility. Be sure to manage your positions carefully.
Technical Sell-Off Risk: Gold prices have risen significantly this year, accumulating significant profit-taking. Any disruption could trigger a technical sell-off, leading to a larger-than-expected correction.
Dagangan aktif
Gold Trend Analysis and Trading Strategy Report:
Key Insights: Gold is in a strong long-term bull market, with short-term trends driven by the Federal Reserve's interest rate decision. It is expected to remain volatile at high levels before the decision. Trading strategies should primarily focus on buying on dips and following the trend, but caution should be exercised against the "buy the expectation, sell the reality" market after the decision.
I. Core Drivers (Fundamentals)
Strong Expectations of a Rate Cut: Weak US labor market data has the market extremely confident that the Fed will implement its first rate cut this week. This is the core driving force behind gold's continued record highs.
Shifting Focus of Expectations: The market is no longer debating whether to cut rates, but is focusing on the magnitude of the cut and the subsequent path. The mainstream expectation is that the Fed may implement two consecutive 25 basis point rate cuts in September and October.
Political Pressure: Former President Trump's calls for "substantial rate cuts" have intensified market expectations for looser policies.
Strong Momentum: The year-to-date gain of 39% indicates a positive influx of long-term funds and extremely optimistic market sentiment.
II. Technical Analysis
Long-Term Trend (Daily/Weekly Charts):
Trend: Strongly Bullish. The price continues to hit new all-time highs, achieving four consecutive weekly gains.
Key Signals: No valid bearish reversal signals (such as high-level shooting stars or engulfing candlesticks) have been observed, indicating that the uptrend is intact and a top has not yet been reached.
Short-Term Trend (1-Hour Chart):
Pattern: After reaching a new high, it has entered a high-level consolidation pattern.
Characteristics: The market is awaiting new directional momentum from the major event of the Federal Reserve's interest rate decision.
III. Key Price Levels
Support Areas:
First Support: $3,625-3,615
Second Support: $3,600
Resistance Areas:
First Resistance: $3,655-3,665
Second Resistance: $3,674
IV. Specific Trading Strategies
Pre-Federal Reserve Decision (Swing Strategy):
Strategy: Buy low and sell high within the key support and resistance range.
Operation:
Consider buying on dips when the price retraces to the $3,625-3,615 support area.
When the price rebounds to around the 3655-3665 resistance area, consider shorting on rallies.
Risk control: Be sure to set a stop loss. Once the oscillation range is broken, the strategy must be adjusted in time.
V. Summary and Risk Warnings
Overall Trend: The long-term bullish trend remains unchanged, but short-term volatility will increase sharply.
Core Risk: This week's Federal Reserve interest rate decision is the biggest source of uncertainty. The tone of Powell's speech is more important than the rate cut itself.
Recommendation: Maintain a light position before the event and maintain a strict stop-loss. After an event occurs, follow the trend according to the new direction and do not blindly guess the top.
Penerbitan berkaitan
Penafian
Maklumat dan penerbitan adalah tidak dimaksudkan untuk menjadi, dan tidak membentuk, nasihat untuk kewangan, pelaburan, perdagangan dan jenis-jenis lain atau cadangan yang dibekalkan atau disahkan oleh TradingView. Baca dengan lebih lanjut di Terma Penggunaan.
Penerbitan berkaitan
Penafian
Maklumat dan penerbitan adalah tidak dimaksudkan untuk menjadi, dan tidak membentuk, nasihat untuk kewangan, pelaburan, perdagangan dan jenis-jenis lain atau cadangan yang dibekalkan atau disahkan oleh TradingView. Baca dengan lebih lanjut di Terma Penggunaan.