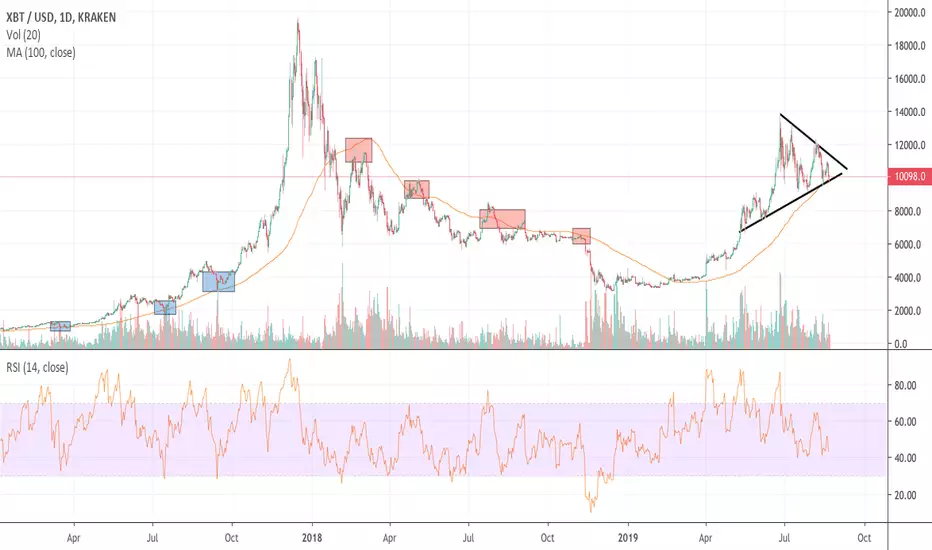
The 100-day moving average has always been a good indicator of the Bitcoin market. Bull markets are supported by it (highlighted in blue) and bear markets are rejected by it (highlighted in red).
On February 20th we started trading above the 100 day MA. This was certainly one of the catalyzing events that propelled this latest bull run. We are now testing this moving average once again. If it holds (coincidentally also at the 10k phycological level) it will be a strong indicator that the bull run of the last few months is actually the beginning of another bullish market cycle.
Keep an eye on it!!!
Happy trading!
Like comment and subscribe!
Penafian
Maklumat dan penerbitan adalah tidak dimaksudkan untuk menjadi, dan tidak membentuk, nasihat untuk kewangan, pelaburan, perdagangan dan jenis-jenis lain atau cadangan yang dibekalkan atau disahkan oleh TradingView. Baca dengan lebih lanjut di Terma Penggunaan.
Penafian
Maklumat dan penerbitan adalah tidak dimaksudkan untuk menjadi, dan tidak membentuk, nasihat untuk kewangan, pelaburan, perdagangan dan jenis-jenis lain atau cadangan yang dibekalkan atau disahkan oleh TradingView. Baca dengan lebih lanjut di Terma Penggunaan.