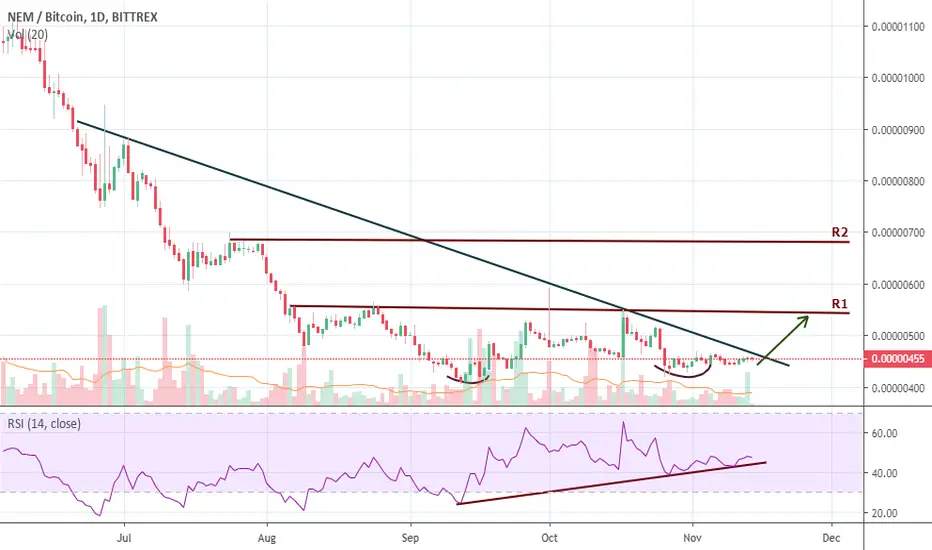
Based on the chart, NEM probably bottomed at 410-420 sats. It perfectly held the previous low when the price retest the support/previous low at 410-420 sats.
In addition, RSI shows a strong sign that it is now in an upward trend.
Now, if the price breaks the trendline it will test the 1st resistance line at 550 sats.
Just remember don't forget to set up a stop-loss because most of the ALTCOINS follow the BITCOIN movement.
Hit Like and Follow me for more updates!
Happy Trading!
Please do your charting and research.
Penafian
Maklumat dan penerbitan adalah tidak dimaksudkan untuk menjadi, dan tidak membentuk, nasihat untuk kewangan, pelaburan, perdagangan dan jenis-jenis lain atau cadangan yang dibekalkan atau disahkan oleh TradingView. Baca dengan lebih lanjut di Terma Penggunaan.
Penafian
Maklumat dan penerbitan adalah tidak dimaksudkan untuk menjadi, dan tidak membentuk, nasihat untuk kewangan, pelaburan, perdagangan dan jenis-jenis lain atau cadangan yang dibekalkan atau disahkan oleh TradingView. Baca dengan lebih lanjut di Terma Penggunaan.