Exxon Mobil Stock Outlook: Fundamentals + Technicals Aligned
📌 Exxon Mobil Corporation (XOM) — Bullish Master Plan (Swing / Scalping Trade)
🛠️ Plan Setup (Thief Strategy)
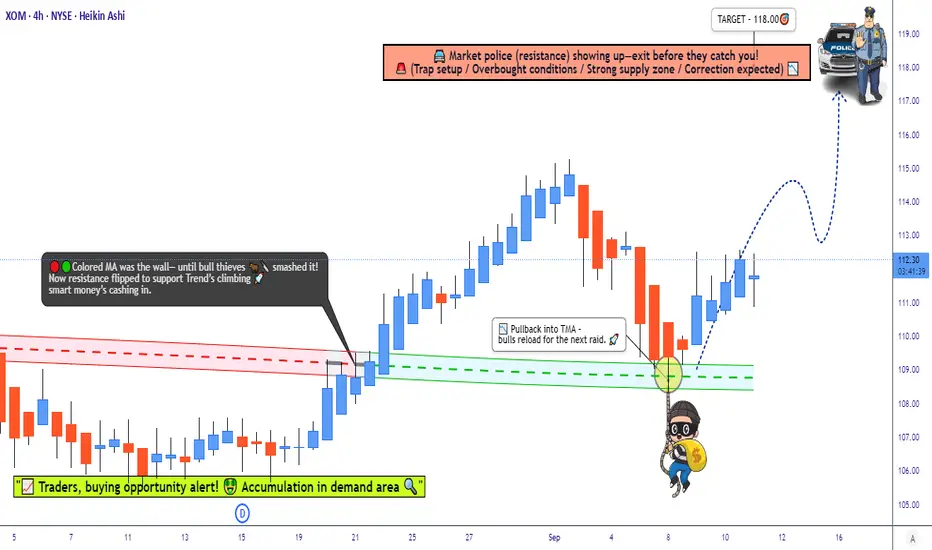
Bias: Bullish — Triangular Moving Average Pullback 📈
Entry: Multiple layered limit orders at 🔹 $110.00 🔹 $111.00 🔹 $112.00 (You can adjust layers based on your own strategy).
Stop Loss (Protective Layer): $108.00 (adjust to your own risk preference).
Target Zone: Around $118.00 (key resistance area).
⚠️ Note: These levels are not financial advice. Manage risk carefully and adjust according to your own strategy.
❓ Why This Plan?
This Thief Plan Strategy uses layered limit orders for flexible entries. It combines technical pullback signals with fundamental, macro, sentiment, and fear/greed insights to build a confluence-based trade idea.
📊 Stock Price Overview
Daily Change: -0.20% (from $112.50 previous close)
1-Month Trend: +5.66% (from $106.27 on Aug 12)
1-Year Trend: -4.21% (from $117.22 in Sep 2024)
Year-to-Date: +2.26% (from $109.57 in 2024)
😊 Investor Sentiment
Retail Investors: 50.76% bullish 😄
Institutional Investors: 47.25% bearish 😕
Overall Mood: Mixed ⚖️
😨 Fear & Greed Index
Current Level: 39 (Fear)
Interpretation: Cautious tone, may signal undervaluation.
📈 Fundamental Score (7.55/10) ✅
Strong revenue: $340.57B in 2024 (+1.16% YoY) 💰
Stable dividend: $0.99/share quarterly 🎉
Weaknesses: Net profit -6.47% in 2024, higher operating costs 📉
🌍 Macro Score (6.8/10) 🌎
Oil demand projected to rise 20% by 2050 🛢️
Geopolitical risks support oil prices 🔥
OPEC+ output hike could moderate momentum 📉
🐂🐻 Market Outlook
Consensus: Neutral → Mildly Bullish ⚖️
Analyst Ratings: Moderate Buy (12 Buy, 7 Hold, 0 Sell)
Key Drivers: Stable fundamentals + oil price volatility = balanced setup.
🔑 Takeaway
Exxon Mobil (XOM) offers a layered-entry bullish opportunity with mixed sentiment but strong long-term fundamentals.
Fear-dominated mood may provide contrarian opportunities.
Keep an eye on oil prices & geopolitics for momentum triggers.
Layering strategy provides flexibility across multiple levels. 🚀
🔗 Related Pairs to Watch (in USD)
Chevron Corporation (CVX): Another oil major with similar exposure to crude prices. 🛢️
United States Oil Fund (USO): Tracks WTI crude oil prices, a key driver for XOM. 📈
Energy Select Sector SPDR Fund (XLE): Broad energy sector ETF for context. 💡
✨ “If you find value in my analysis, a 👍 and 🚀 boost is much appreciated — it helps me share more setups with the community!”
#XOM #ExxonMobil #EnergyStocks #SwingTrade #Scalping #StockMarket #Oil #Fundamentals #TechnicalAnalysis #Macro #FearGreedIndex #TradingStrategy #LayeredEntry #StockIdeas
🛠️ Plan Setup (Thief Strategy)
Bias: Bullish — Triangular Moving Average Pullback 📈
Entry: Multiple layered limit orders at 🔹 $110.00 🔹 $111.00 🔹 $112.00 (You can adjust layers based on your own strategy).
Stop Loss (Protective Layer): $108.00 (adjust to your own risk preference).
Target Zone: Around $118.00 (key resistance area).
⚠️ Note: These levels are not financial advice. Manage risk carefully and adjust according to your own strategy.
❓ Why This Plan?
This Thief Plan Strategy uses layered limit orders for flexible entries. It combines technical pullback signals with fundamental, macro, sentiment, and fear/greed insights to build a confluence-based trade idea.
📊 Stock Price Overview
Daily Change: -0.20% (from $112.50 previous close)
1-Month Trend: +5.66% (from $106.27 on Aug 12)
1-Year Trend: -4.21% (from $117.22 in Sep 2024)
Year-to-Date: +2.26% (from $109.57 in 2024)
😊 Investor Sentiment
Retail Investors: 50.76% bullish 😄
Institutional Investors: 47.25% bearish 😕
Overall Mood: Mixed ⚖️
😨 Fear & Greed Index
Current Level: 39 (Fear)
Interpretation: Cautious tone, may signal undervaluation.
📈 Fundamental Score (7.55/10) ✅
Strong revenue: $340.57B in 2024 (+1.16% YoY) 💰
Stable dividend: $0.99/share quarterly 🎉
Weaknesses: Net profit -6.47% in 2024, higher operating costs 📉
🌍 Macro Score (6.8/10) 🌎
Oil demand projected to rise 20% by 2050 🛢️
Geopolitical risks support oil prices 🔥
OPEC+ output hike could moderate momentum 📉
🐂🐻 Market Outlook
Consensus: Neutral → Mildly Bullish ⚖️
Analyst Ratings: Moderate Buy (12 Buy, 7 Hold, 0 Sell)
Key Drivers: Stable fundamentals + oil price volatility = balanced setup.
🔑 Takeaway
Exxon Mobil (XOM) offers a layered-entry bullish opportunity with mixed sentiment but strong long-term fundamentals.
Fear-dominated mood may provide contrarian opportunities.
Keep an eye on oil prices & geopolitics for momentum triggers.
Layering strategy provides flexibility across multiple levels. 🚀
🔗 Related Pairs to Watch (in USD)
Chevron Corporation (CVX): Another oil major with similar exposure to crude prices. 🛢️
United States Oil Fund (USO): Tracks WTI crude oil prices, a key driver for XOM. 📈
Energy Select Sector SPDR Fund (XLE): Broad energy sector ETF for context. 💡
✨ “If you find value in my analysis, a 👍 and 🚀 boost is much appreciated — it helps me share more setups with the community!”
#XOM #ExxonMobil #EnergyStocks #SwingTrade #Scalping #StockMarket #Oil #Fundamentals #TechnicalAnalysis #Macro #FearGreedIndex #TradingStrategy #LayeredEntry #StockIdeas
Dagangan aktif
Dagangan ditutup: sasaran tercapai
📊 Exxon Mobil Corporation (XOM) Real-Time Data Report - October 12, 2025🛢️ Stock Price Overview
Current Price: $110.73 USD 💰
Open: $112.255
High: $112.62
Low: $110.71
Previous Close: $112.91
Market Cap: $472.07B 🏦
52-Week Range: $97.80 - $124.26 📈
📅 Recent Performance
1-Day Change: -1.93% 📉
1-Month Trend: Down from $112.75 (Sep 2025) 📉
1-Year Trend: Down from $116.78 (Oct 2024) 📉
📈 Fundamental Score
Score: 7.5/10 ✅
Key Points:
Strong revenue: $329.82B (TTM) 💸
Net income: $31.02B (TTM) 🤑
Dividend yield: 3.47% 🎁
EPS: $7.06 📊
Efficiency drive with workforce reduction for profitability 🚀
🌍 Macro Score
Score: 6.8/10 🌎
Key Points:
Oil price volatility impacting upstream earnings 🛢️
Global energy demand stable but sensitive to economic shifts ⚖️
New projects (e.g., Guyana) boosting long-term growth 🌱
📆 Seasonal Tendencies
October Historically: Mixed, with slight bullish tendency (avg. +0.5% over past 5 years) 📅
Energy Sector: Stronger in Q4 due to winter demand ⛄
💹 Economic Indicators
Interest Rates: Elevated, Federal Reserve holding rates steady at 4.75-5% 🏦
Inflation Rates: Moderate at 2.5% annually, stable energy costs 🔄
Economic Growth: U.S. GDP growth at 2.2%, slow but steady 📈
Jobs Market: Unemployment at 4.1%, resilient but cooling slightly 💼
Bank Orders: Neutral, no significant buy/sell pressure from banks 🏛️
😊 Trader Sentiment
Retail Traders:
Bullish: 45% 🐂
Bearish: 35% 🐻
Neutral: 20% ⚖️
Institutional Traders:
Bullish: 50% 🐂
Bearish: 30% 🐻
Neutral: 20% ⚖️
Institutional Activity Signal: Moderate buying, focus on long-term value 📈
Crowd Sentiment Signal: Cautiously optimistic, driven by dividend stability 😊
😱 Fear & Greed Index
Current Level: 55/100 (Neutral, leaning Greed) 😎
Mood: Investors optimistic about energy sector stability but cautious on oil price swings ⚖️
📡 Overall Market Outlook
Outlook: Neutral ⚖️
Reason: Balanced by strong fundamentals and dividends but tempered by oil price volatility and macro uncertainties 🔄
💰 Money-Making Analysis
• Forex💹
• Indices📈
• Crypto ₿
• Commodities⚡
• Stocks🏦
• Fundamental + Macro📊
• Sentiment🔎
👉 Ask what analysis you need & get it FREE!
Join Discord for signals + data & grab the Master Plan: discord.gg/ZQS3y7FhVr
• Forex💹
• Indices📈
• Crypto ₿
• Commodities⚡
• Stocks🏦
• Fundamental + Macro📊
• Sentiment🔎
👉 Ask what analysis you need & get it FREE!
Join Discord for signals + data & grab the Master Plan: discord.gg/ZQS3y7FhVr
Penerbitan berkaitan
Penafian
Maklumat dan penerbitan adalah tidak dimaksudkan untuk menjadi, dan tidak membentuk, nasihat untuk kewangan, pelaburan, perdagangan dan jenis-jenis lain atau cadangan yang dibekalkan atau disahkan oleh TradingView. Baca dengan lebih lanjut di Terma Penggunaan.