Usually there is no need to overcomplicate things. Fibs works amazingly well when you combine those with oscillators and for example multiple Stoch RSI -sets.
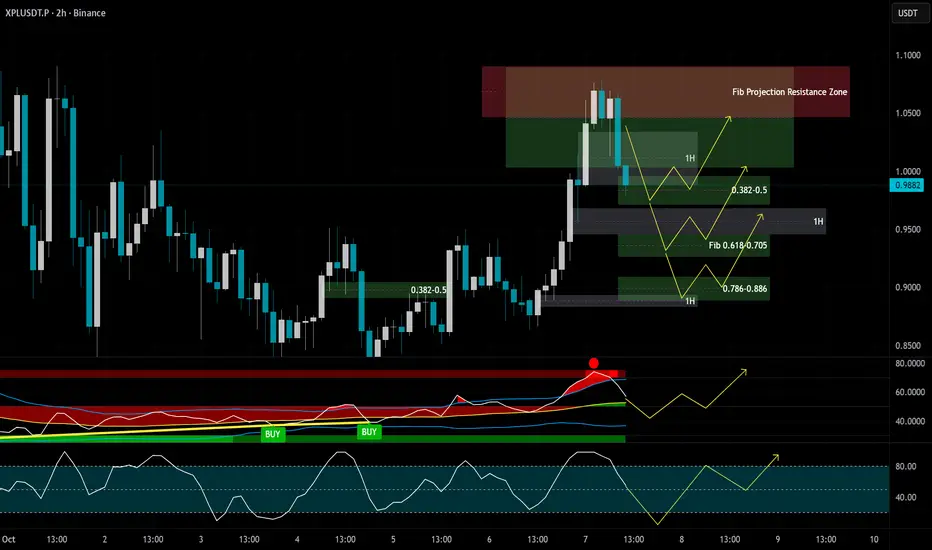
This chart has Easy Algo's TDI X indicator + Stoch RSI in default fast mode.
You just have to align multiple confluences at certain point giving little leeway on overlapping things, meaning everything does't need to be perfectly aligned just enough.
What's enough? That is the backtesting work you have to do yourself so that you will learn. If you rely on my or others TA only that is not the path to success and profitable trading. You will learn that when ppl talk about golden pockets publicly and those sometimes works amazingly well it will be widely used so market makers have to destroy those working patterns all the time to not let retail traders get easy money.
Think of it kind of guarantee that if you study and work hard you will get success but those lazy ones who gamble, over leverage in wrong levels they will get wrecked most of the time because we all can't be profitable at the same time. Markets doesn't work that way. It's exactly like if we super simplify things and think that you win and I loose, you get my money and vice versa. If there is third party and we both win, we get that third party's money.
Crypto grandpa sharing charts & setups. Free TA, zero fluff.
Not financial advice — still two feet above ground.
Follow me here and on Twitter X. Thanks!
Not financial advice — still two feet above ground.
Follow me here and on Twitter X. Thanks!
Penafian
Maklumat dan penerbitan adalah tidak dimaksudkan untuk menjadi, dan tidak membentuk, nasihat untuk kewangan, pelaburan, perdagangan dan jenis-jenis lain atau cadangan yang dibekalkan atau disahkan oleh TradingView. Baca dengan lebih lanjut di Terma Penggunaan.