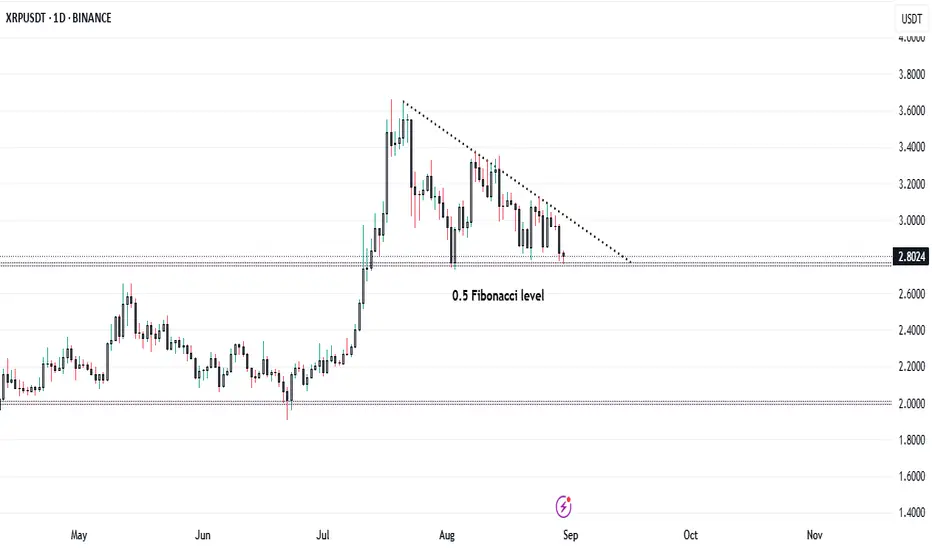
XRP is currently hovering around the $2.80 level, sitting precisely at the 0.5 Fibonacci retracement zone, which has been acting as a strong support level in recent sessions.
📉 Technical Structure:
* Price action has formed a descending triangle pattern, indicating a period of consolidation following the sharp rally in July.
* The 0.5 Fibonacci level ($2.80) is a critical zone to watch; a strong bounce here could signal renewed bullish momentum.
* A break below $2.80 could open the doors for a retest of the 0.618 Fibonacci level ($2.60) or even deeper support near $2.00.
* On the upside, a breakout above the descending trendline would be the first sign of strength, potentially driving XRP back towards $3.40–$3.80 resistance levels.
⚠️ Key Takeaway:
XRP is at a make-or-break level. Bulls must defend $2.80 to keep the broader uptrend intact, while bears are eyeing a decisive breakdown to extend the correction phase. Traders should stay alert for a confirmed breakout or breakdown from this tight consolidation range.
💡 Strategy Watch:
* Aggressive traders may look for long entries near $2.80 support with tight stops.
* Conservative traders can wait for confirmation: a break above the trendline for bullish momentum or a clean break below $2.80 for bearish continuation.
Penafian
The information and publications are not meant to be, and do not constitute, financial, investment, trading, or other types of advice or recommendations supplied or endorsed by TradingView. Read more in the Terms of Use.
Penafian
The information and publications are not meant to be, and do not constitute, financial, investment, trading, or other types of advice or recommendations supplied or endorsed by TradingView. Read more in the Terms of Use.