Is XTI/USD Setting Up for a Sharp Bearish Correction?
🚨 WTI/USD CRUDE OIL: THE BEARISH HEIST AWAITS 🎯
═══════════════════════════════════════════════════════════
THE SETUP: Breaking Down The Crime Scene 🕵️♂️
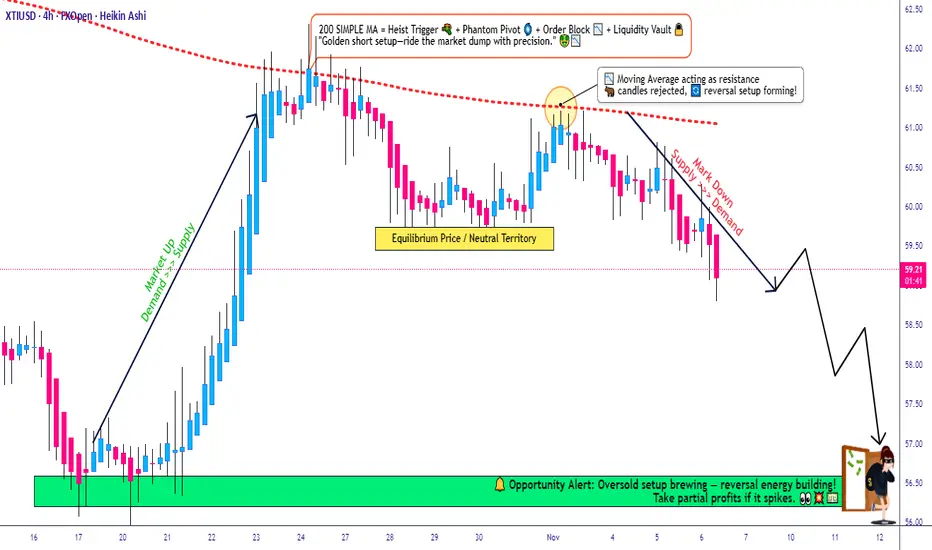
We're executing a bearish pullback strategy on WTI/USD spot crude oil, leveraging the 200-period Simple Moving Average (SMA) as our primary technical confirmation. The energy sector is flashing opportunity signals, and it's time to work the levels like a seasoned professional.
📊 STRATEGY FRAMEWORK
Market Direction: Bearish Pullback from 200 SMA Resistance
Timeframe: Suitable for Swing & Day Trading Operations
Asset Class: Energies | WTI Crude Oil Spot
💰 THE LAYERED ENTRY STRATEGY (Multi-Level Approach)
This is where the Thief Method shines—stacking limit orders at key price levels to accumulate positions as the market comes to you:
Suggested Entry Layer Points:
Layer 1: 60.50 💧
Layer 2: 60.00 💧
Layer 3: 59.50 💧
Layer 4: 59.00 💧
⚠️ Pro Tip: Feel free to add or adjust layers based on your risk tolerance and position size. The beauty of this method is scalability—customize to YOUR account size and risk parameters.
🛑 STOP LOSS PLACEMENT
Primary SL Level: 61.00
Positioned at the nearest swing high/candle wick resistance above our entry cluster. This respects natural market structure and gives us a defined, measurable risk point.
⚡ DISCLAIMER ON RISK MANAGEMENT:
This is NOT financial advice. Risk management is YOUR responsibility. The suggested SL is based on technical structure, but YOU control your account. Set stops that align with YOUR risk tolerance. Trade only what you can afford to lose.
🎯 PROFIT TARGET STRUCTURE
Primary Target: 56.50
Secondary Support Level: 56.00 — A police barricade of strength where multiple factors converge:
Strong historical support confluence 📍
Oversold zone recognition ⚖️
Potential reversal trap (exit strategy alert) ⚠️
Exit Strategy: Consider banking profits at 56.50 before support intensifies at 56.00. Lock in gains as the technical structure suggests potential friction.
⚡ DISCLAIMER ON PROFIT TARGETS:
Again, these are TECHNICAL levels only. YOU decide your exit strategy. Whether you take full profits at 56.50, trail stops, or use partial exits—this is YOUR trading plan. No setup is guaranteed.
🔗 RELATED PAIRS TO WATCH (Correlation Check)
Understanding energy market interrelations helps you spot confirmation signals:
US Dollar Index ( DXY) → Inverse correlation to crude oil. Strengthen USD = Bearish pressure on oil. Watch DXY for confirmation of our bearish bias.
 S&P 500 (
 SPY /
SPY /  ES1!) → Risk sentiment indicator. If equities weaken, crude often follows bearish patterns. Check equity trends for macro confirmation.
Energy Select Sector ETF ( XLE) → Direct correlation. Tracks large-cap energy stocks. Oil weakness often precedes XLE drops.

 EURUSD → Global risk sentiment. Weak euro = risk-off environment = potential crude weakness. Monitor for macro context.
 USO (Crude Oil ETF) → Direct oil tracking instrument. Moves in lockstep with WTI. Use for backup confirmation.
📋 THE THIEF STRATEGY CHECKLIST
✅ Confirm 200 SMA as resistance/bearish context
✅ Stack limit orders—don't chase price
✅ Define your personal stop loss (around 61.00 structure)
✅ Target scale-outs near 56.50-56.00
✅ Use correlation pairs for macro confirmation
✅ Manage position size ruthlessly
✅ Accept losses—they're tuition in the market
💬 ENGAGEMENT BOOST
✨ If you find value in my analysis, a 👍 and 🚀 boost is much appreciated — it helps me share more setups with the community!
#WTI #CrudeOil #EnergyTrading #TechnicalAnalysis #ThiefStrategy #SwingTrading #DayTrading #Trading101 #ForexEnergy #MultiLayerEntry #RiskManagement #TradingSetup #FinancialMarkets #Energies #TradingCommunity
═══════════════════════════════════════════════════════════
THE SETUP: Breaking Down The Crime Scene 🕵️♂️
We're executing a bearish pullback strategy on WTI/USD spot crude oil, leveraging the 200-period Simple Moving Average (SMA) as our primary technical confirmation. The energy sector is flashing opportunity signals, and it's time to work the levels like a seasoned professional.
📊 STRATEGY FRAMEWORK
Market Direction: Bearish Pullback from 200 SMA Resistance
Timeframe: Suitable for Swing & Day Trading Operations
Asset Class: Energies | WTI Crude Oil Spot
💰 THE LAYERED ENTRY STRATEGY (Multi-Level Approach)
This is where the Thief Method shines—stacking limit orders at key price levels to accumulate positions as the market comes to you:
Suggested Entry Layer Points:
Layer 1: 60.50 💧
Layer 2: 60.00 💧
Layer 3: 59.50 💧
Layer 4: 59.00 💧
⚠️ Pro Tip: Feel free to add or adjust layers based on your risk tolerance and position size. The beauty of this method is scalability—customize to YOUR account size and risk parameters.
🛑 STOP LOSS PLACEMENT
Primary SL Level: 61.00
Positioned at the nearest swing high/candle wick resistance above our entry cluster. This respects natural market structure and gives us a defined, measurable risk point.
⚡ DISCLAIMER ON RISK MANAGEMENT:
This is NOT financial advice. Risk management is YOUR responsibility. The suggested SL is based on technical structure, but YOU control your account. Set stops that align with YOUR risk tolerance. Trade only what you can afford to lose.
🎯 PROFIT TARGET STRUCTURE
Primary Target: 56.50
Secondary Support Level: 56.00 — A police barricade of strength where multiple factors converge:
Strong historical support confluence 📍
Oversold zone recognition ⚖️
Potential reversal trap (exit strategy alert) ⚠️
Exit Strategy: Consider banking profits at 56.50 before support intensifies at 56.00. Lock in gains as the technical structure suggests potential friction.
⚡ DISCLAIMER ON PROFIT TARGETS:
Again, these are TECHNICAL levels only. YOU decide your exit strategy. Whether you take full profits at 56.50, trail stops, or use partial exits—this is YOUR trading plan. No setup is guaranteed.
🔗 RELATED PAIRS TO WATCH (Correlation Check)
Understanding energy market interrelations helps you spot confirmation signals:
US Dollar Index (
Energy Select Sector ETF (
📋 THE THIEF STRATEGY CHECKLIST
✅ Confirm 200 SMA as resistance/bearish context
✅ Stack limit orders—don't chase price
✅ Define your personal stop loss (around 61.00 structure)
✅ Target scale-outs near 56.50-56.00
✅ Use correlation pairs for macro confirmation
✅ Manage position size ruthlessly
✅ Accept losses—they're tuition in the market
💬 ENGAGEMENT BOOST
✨ If you find value in my analysis, a 👍 and 🚀 boost is much appreciated — it helps me share more setups with the community!
#WTI #CrudeOil #EnergyTrading #TechnicalAnalysis #ThiefStrategy #SwingTrading #DayTrading #Trading101 #ForexEnergy #MultiLayerEntry #RiskManagement #TradingSetup #FinancialMarkets #Energies #TradingCommunity
Dagangan ditutup secara manual
💰 Money-Making Analysis
• Forex💹
• Indices📈
• Crypto ₿
• Commodities⚡
• Stocks🏦
• Fundamental + Macro📊
• Sentiment🔎
👉 Ask what analysis you need & get it FREE!
Join Discord for signals + data & grab the Master Plan: discord.gg/ZQS3y7FhVr
• Forex💹
• Indices📈
• Crypto ₿
• Commodities⚡
• Stocks🏦
• Fundamental + Macro📊
• Sentiment🔎
👉 Ask what analysis you need & get it FREE!
Join Discord for signals + data & grab the Master Plan: discord.gg/ZQS3y7FhVr
Penerbitan berkaitan
Penafian
The information and publications are not meant to be, and do not constitute, financial, investment, trading, or other types of advice or recommendations supplied or endorsed by TradingView. Read more in the Terms of Use.