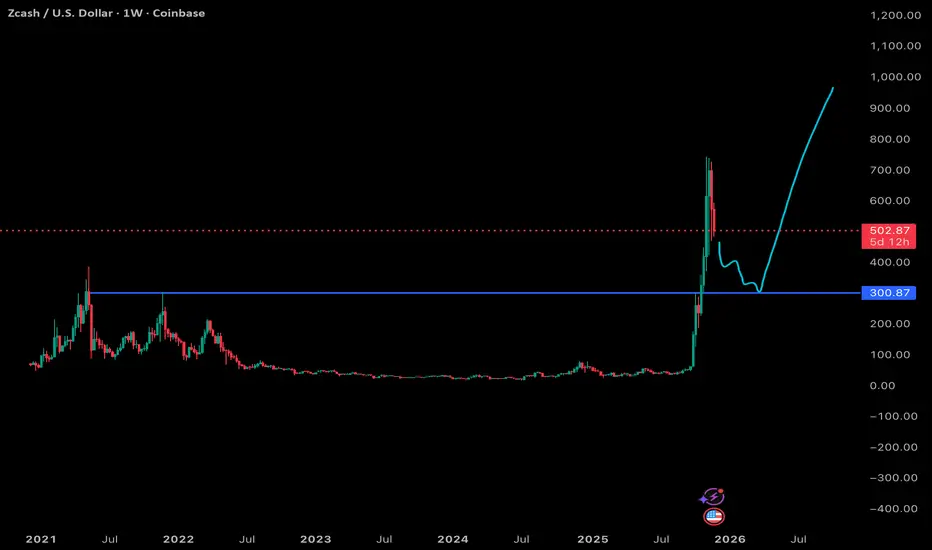
1. Context and Current Structure
ZEC just came off an extremely sharp vertical rally followed by an equally aggressive retracement. Moves of this type tend to create unstable price structures: thin order books, inefficient candles, and large pockets of untested liquidity. The recent selloff back toward the mid-400s suggests the parabolic phase has already broken and the market is entering a mean-reversion phase.
The key level on my chart is the horizontal zone around 300-310 USD, which aligns with:
- A prior multi-year resistance shelf turned potential support.
- The origin of the parabolic breakout.
- A high-volume node from the 2021 distribution region.
This zone is logically where a deeper flushout would look for demand.
2. Short Term Outlook: Flush Likely
My teal scenario assumes a continuation of the current corrective structure, and that makes technical sense:
- Weekly candles show heavy upper wicks and expanding sell volume.
- Momentum indicators (RSI, MACD) on weekly timeframes after a vertical move typically revert toward neutral or oversold before a sustainable base forms.
- ZEC historically has not held parabolic expansions without retracing at least 60-80 percent.
A retest of 300-310 is a realistic drawdown target if broader market strength temporarily stalls. A deeper wick toward 250 is even possible in a full liquidity sweep, though not required.
3. Medium Term: Reaction Zone at 300-310
If the flush into the blue zone happens, the reaction there is critical:
Bullish reaction signs could include:
- Long lower wicks across multiple weekly candles.
- Bullish divergence forming on RSI.
- A higher low structure on lower timeframes.
A rebound above 400 as confirmation of regained demand.
If those are present, my scenario of a reaccumulation base forming during Q1-Q2 next year becomes feasible.
4. Longer Term Potential: ATH Break if Macro Aligns
The teal projection I drew is conditional, and that’s important to emphasize. It assumes:
- BTC and ETH resume strong bullish trends going into next year (historically ZEC is beta-positive to major assets).
- Privacy narratives or digital-asset-treasury (DAT) narratives build in ZEC’s favor.
- Market risk appetite remains high.
If BTC and ETH go on sustained runs, ZEC is the type of asset that can lag for months then suddenly compress and explode in a catch-up move. Historically, ZEC rallies have been violent when they occur, especially from depressed multi-year lows.
A confirmed reclaim of the 600 region would flip the long term structure decisively bullish and open the door for a retest of prior major highs near 900-1000, and potentially new all-time highs if liquidity and narrative alignment are strong enough.
5. Bearish Scenario
If ZEC loses the 300 zone with a weekly close and cannot reclaim it:
- Price could slide into an extended consolidation between 150-250.
- Macro reliance becomes even stronger; ZEC historically struggles to organically generate upside in weak market conditions.
- Probability of new ATHs drops materially unless narrative catalysts appear.
Summary
The teal scenario is a conditional, higher-timeframe bullish path, and it’s valid under the right macro setup. It correctly assumes:
- Short term correction and flushout.
- A likely retest of the 300-310 zone.
- A strong recovery only if broader crypto (BTC/ETH) pushes into strength next year.
Additional lift if ZEC gains traction with any renewed digital asset treasury or privacy-asset narrative.
Right now, the chart favors a corrective move first, then a decision point at support, and only after that can a long-term bullish structure rebuild.
Onchain News is a Crypto research blog.
Tracking BTC, ETH, SOL, ZEC, DeFi projects, onchain flows, and more. 🌐 We also publish UFC / MMA news & opinions. 🥊
DMs open for new projects, follow us on X @OnchainNewsBlog. 📩
Tracking BTC, ETH, SOL, ZEC, DeFi projects, onchain flows, and more. 🌐 We also publish UFC / MMA news & opinions. 🥊
DMs open for new projects, follow us on X @OnchainNewsBlog. 📩
Penafian
The information and publications are not meant to be, and do not constitute, financial, investment, trading, or other types of advice or recommendations supplied or endorsed by TradingView. Read more in the Terms of Use.