ZEC’s price rally shows signs of further continuation as momentum and trend indicators align in favor of the bulls.
On the daily chart, the MACD line currently sits above the signal line, reflecting strong buying momentum and suggesting that market participants continue to accumulate rather than distribute. This bullish crossover signals control by buyers and reinforces the upward trend.
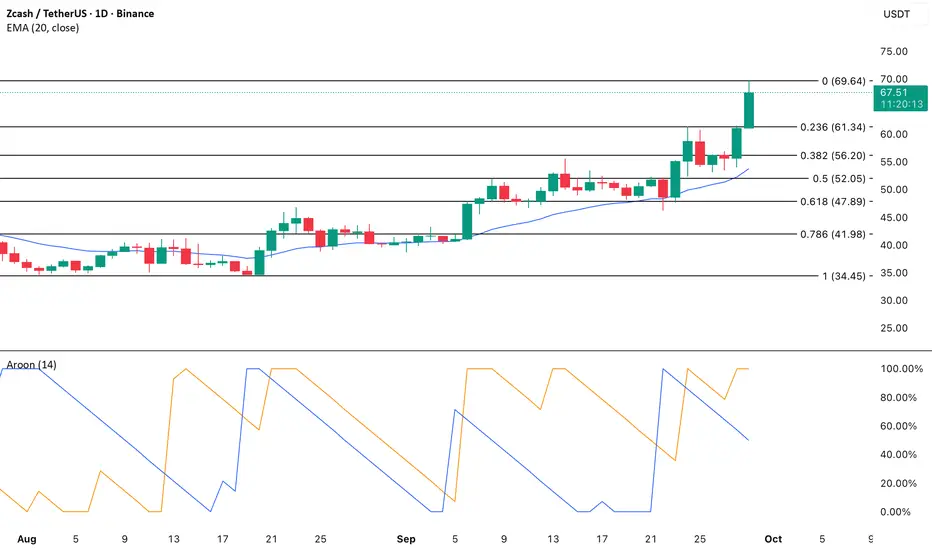
Adding to this view, the Aroon Up Line has surged to 100%, a reading that signals a dominant uptrend. The Aroon indicator tracks how frequently new highs and lows are made, and a strong Up Line reading suggests consistent higher highs and sustained bullish sentiment.
With ZEC trading at levels last seen in December 2024, this momentum reflects renewed investor confidence and opens the door for further gains if bullish conviction holds.
On the daily chart, the MACD line currently sits above the signal line, reflecting strong buying momentum and suggesting that market participants continue to accumulate rather than distribute. This bullish crossover signals control by buyers and reinforces the upward trend.
Adding to this view, the Aroon Up Line has surged to 100%, a reading that signals a dominant uptrend. The Aroon indicator tracks how frequently new highs and lows are made, and a strong Up Line reading suggests consistent higher highs and sustained bullish sentiment.
With ZEC trading at levels last seen in December 2024, this momentum reflects renewed investor confidence and opens the door for further gains if bullish conviction holds.
Truly Unbiased Cryptocurrency News beincrypto.com
Penafian
Maklumat dan penerbitan adalah tidak dimaksudkan untuk menjadi, dan tidak membentuk, nasihat untuk kewangan, pelaburan, perdagangan dan jenis-jenis lain atau cadangan yang dibekalkan atau disahkan oleh TradingView. Baca dengan lebih lanjut di Terma Penggunaan.