ZM | Long Setup | Range-to-Trend Re-Rate on AI UCaaS/CCaaS Pivot | Nov 24, 2025
🔹 Thesis Summary
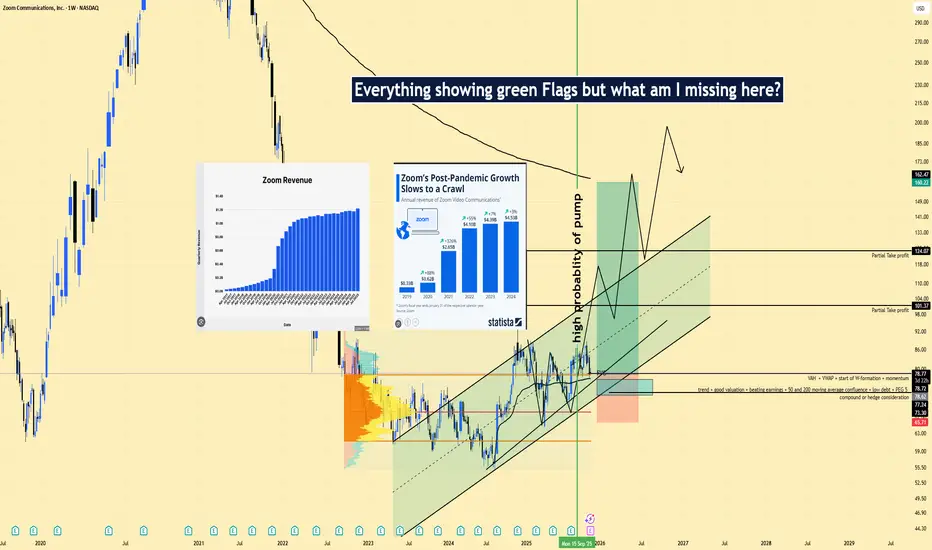
Zoom is exiting a two-year base and riding a rising channel as the mix shifts from “meetings” to a broader AI-enabled UCaaS/CCaaS stack. If growth stabilizes and margins hold, a multiple re-rate from ~13x fwd EPS is plausible into 2026.
🔹 Trade Setup
Bias: Long
Entry Zone: $76–$81 (value area/POC ≈ $79)
Stop Loss: $68.5 (below channel base & prior swing lows)
Take-Profits:
TP1: $101.4
TP2: $118.5
TP3: $124.1
Max Target: $160–$165
🔹 Narrative & Context
Structure: Weekly rising channel since 2023 with a completed W-formation; price keeps reclaiming the VAH ~ $79 with positive reactions near value area lows.
Quality of sponsor base: ~77% institutional ownership with >1,000 holders; consistent EPS beats on the most recent quarters and revenue holding near $1.1–$1.2B/qtr.
Product mix shift: Zoom Phone + Contact Center (CCaaS) + AI Companion reduce dependence on commoditized meetings and increase seat/ARPU durability.
Seasonality/flow: 2025 YTD underperformed vs. 2023–2024; mean-reversion tailwind into Dec–Jan is typical for profitable software after weak YTD prints.
🔹 Valuation & Context (Pro Metrics, framed simply)
Forward P/E ≈ 13.3x vs. large-cap software ~24–28x → market prices Zoom like a no-growth asset → if CCaaS/Phone sustain mid-single-digit top-line and stable margins, the discount can narrow—this is the re-rate upside.
P/FCF ≈ 12.8x vs peers high-teens to 20s → cheaper cash generation → supports buybacks and tuck-ins during the pivot.
Quality: ROE ~13.6% / ROIC ~13.2%, Quick Ratio ~4.4 → solid balance sheet, self-funded transition.
Growth: EPS past 5Y +106%, Sales past 5Y +49.6% → post-pandemic decel but still compounding; stability matters more than acceleration for a re-rate.
Risk: Debt/Equity ~0.0x → low leverage limits downside in macro shocks.
🔹 Contrarian Angle (Your Edge)
Consensus still frames ZM as a stagnant “meetings” play. The tape shows accumulation within an ascending channel and improving mix economics. A shift from 13x → 18–20x fwd on steady EPS supports $120–$160 over the next 12–18 months—well above many cautious targets.
🔹 Risks (balanced)
Earnings gap risk & guide sensitivity (event tonight) could pierce the stop before trend resumes.
Competitive bundling from MSFT/GOOGL pressuring seat growth and pricing.
Execution risk scaling CCaaS/AI while protecting margins and security posture.
🔹 Macro Considerations
NDX / 10-Year yields: ZM correlates with duration-sensitive software—lower yields aid the re-rate; rising DXY/yields would cap multiples.
IT spending cadence: Enterprise budget resets (Q1CY) and procurement softness could stall seat adds.
Volatility/hedging: Elevated IV around earnings; consider staged entries or collars/call-spreads if taking exposure into the print.
🔹 Bottom Line
ZM screens inexpensive on forward and FCF multiples with a strong balance sheet and a credible path to mix-led stabilization. The weekly structure offers a defined-risk long from value, aiming for a re-rating toward $120–$160 as CCaaS/AI execution compounds.
🔹 Forward Path
If this post gains traction, I’ll follow up with: (1) weekly/quarterly re-maps of the channel and volume shelves, (2) updates on breakout/invalidations vs. $97/$101/$118/$124, (3) commentary on post-earnings guide and margin cadence.
Like & Follow for structured ideas, not signals. I post high-conviction setups here before broader narratives play out.
⚠️ Disclaimer: This is not financial advice. Always do your own research. Charts and visuals may include AI enhancements.
🔹 Footnote
Forward P/E: Price divided by expected earnings over the next 12 months. Lower = cheaper relative to profits.
P/FCF (Price-to-Free-Cash-Flow): Price vs. the cash left after investments. A measure of efficiency.
FCF Yield: Free cash flow per share ÷ price per share. Higher = more cash returned for each dollar invested.
ROE (Return on Equity): Net income ÷ shareholder equity. Shows management efficiency with investor capital.
ROIC (Return on Invested Capital): Net income ÷ all invested capital (equity + debt). A purer profitability gauge.
Debt/Equity: Debt divided by equity. <1 usually means balance sheet is conservative.
R:R (Risk-to-Reward): Ratio of expected upside vs. downside. 3:1 = you risk $1 to make $3.
🔹 Thesis Summary
Zoom is exiting a two-year base and riding a rising channel as the mix shifts from “meetings” to a broader AI-enabled UCaaS/CCaaS stack. If growth stabilizes and margins hold, a multiple re-rate from ~13x fwd EPS is plausible into 2026.
🔹 Trade Setup
Bias: Long
Entry Zone: $76–$81 (value area/POC ≈ $79)
Stop Loss: $68.5 (below channel base & prior swing lows)
Take-Profits:
TP1: $101.4
TP2: $118.5
TP3: $124.1
Max Target: $160–$165
🔹 Narrative & Context
Structure: Weekly rising channel since 2023 with a completed W-formation; price keeps reclaiming the VAH ~ $79 with positive reactions near value area lows.
Quality of sponsor base: ~77% institutional ownership with >1,000 holders; consistent EPS beats on the most recent quarters and revenue holding near $1.1–$1.2B/qtr.
Product mix shift: Zoom Phone + Contact Center (CCaaS) + AI Companion reduce dependence on commoditized meetings and increase seat/ARPU durability.
Seasonality/flow: 2025 YTD underperformed vs. 2023–2024; mean-reversion tailwind into Dec–Jan is typical for profitable software after weak YTD prints.
🔹 Valuation & Context (Pro Metrics, framed simply)
Forward P/E ≈ 13.3x vs. large-cap software ~24–28x → market prices Zoom like a no-growth asset → if CCaaS/Phone sustain mid-single-digit top-line and stable margins, the discount can narrow—this is the re-rate upside.
P/FCF ≈ 12.8x vs peers high-teens to 20s → cheaper cash generation → supports buybacks and tuck-ins during the pivot.
Quality: ROE ~13.6% / ROIC ~13.2%, Quick Ratio ~4.4 → solid balance sheet, self-funded transition.
Growth: EPS past 5Y +106%, Sales past 5Y +49.6% → post-pandemic decel but still compounding; stability matters more than acceleration for a re-rate.
Risk: Debt/Equity ~0.0x → low leverage limits downside in macro shocks.
🔹 Contrarian Angle (Your Edge)
Consensus still frames ZM as a stagnant “meetings” play. The tape shows accumulation within an ascending channel and improving mix economics. A shift from 13x → 18–20x fwd on steady EPS supports $120–$160 over the next 12–18 months—well above many cautious targets.
🔹 Risks (balanced)
Earnings gap risk & guide sensitivity (event tonight) could pierce the stop before trend resumes.
Competitive bundling from MSFT/GOOGL pressuring seat growth and pricing.
Execution risk scaling CCaaS/AI while protecting margins and security posture.
🔹 Macro Considerations
NDX / 10-Year yields: ZM correlates with duration-sensitive software—lower yields aid the re-rate; rising DXY/yields would cap multiples.
IT spending cadence: Enterprise budget resets (Q1CY) and procurement softness could stall seat adds.
Volatility/hedging: Elevated IV around earnings; consider staged entries or collars/call-spreads if taking exposure into the print.
🔹 Bottom Line
ZM screens inexpensive on forward and FCF multiples with a strong balance sheet and a credible path to mix-led stabilization. The weekly structure offers a defined-risk long from value, aiming for a re-rating toward $120–$160 as CCaaS/AI execution compounds.
🔹 Forward Path
If this post gains traction, I’ll follow up with: (1) weekly/quarterly re-maps of the channel and volume shelves, (2) updates on breakout/invalidations vs. $97/$101/$118/$124, (3) commentary on post-earnings guide and margin cadence.
Like & Follow for structured ideas, not signals. I post high-conviction setups here before broader narratives play out.
⚠️ Disclaimer: This is not financial advice. Always do your own research. Charts and visuals may include AI enhancements.
🔹 Footnote
Forward P/E: Price divided by expected earnings over the next 12 months. Lower = cheaper relative to profits.
P/FCF (Price-to-Free-Cash-Flow): Price vs. the cash left after investments. A measure of efficiency.
FCF Yield: Free cash flow per share ÷ price per share. Higher = more cash returned for each dollar invested.
ROE (Return on Equity): Net income ÷ shareholder equity. Shows management efficiency with investor capital.
ROIC (Return on Invested Capital): Net income ÷ all invested capital (equity + debt). A purer profitability gauge.
Debt/Equity: Debt divided by equity. <1 usually means balance sheet is conservative.
R:R (Risk-to-Reward): Ratio of expected upside vs. downside. 3:1 = you risk $1 to make $3.
I work with busy founders and executives who are tired of ad hoc trading results. I give you a clear, rules based trading system built from my own years in the market, so you can protect capital, compound it, and understand trading like a real business.
Penafian
The information and publications are not meant to be, and do not constitute, financial, investment, trading, or other types of advice or recommendations supplied or endorsed by TradingView. Read more in the Terms of Use.