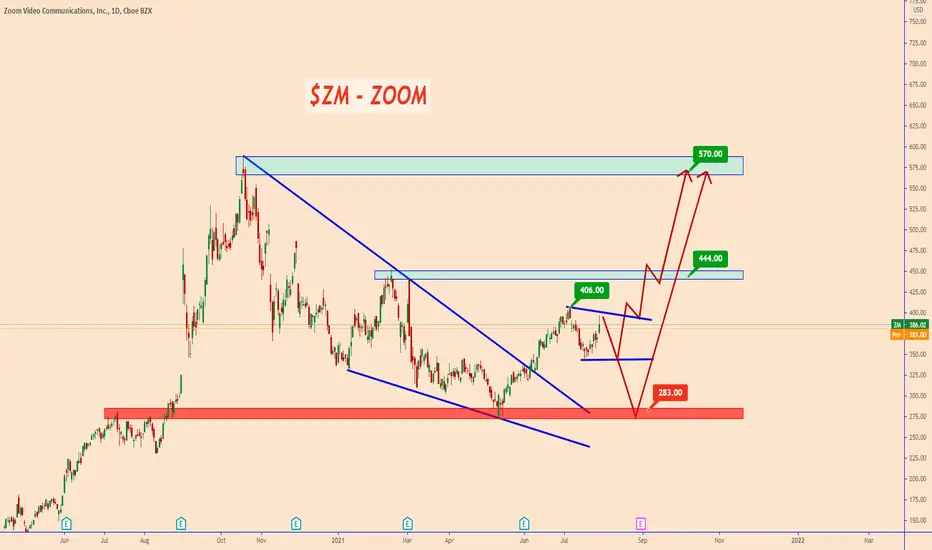
On the daily chart, ZOOM looks very bullish. After the price was corrected we can clearly see a break out from a falling wedge pattern. Anyway, this is only the daily chart development and we have also to anticipate potential corrections along with the upward movement. A potential scenario that I am looking at, is that the price may complete a type of bullish triangle before moving higher again. The second scenario is that the price may retest the low again up to the previous major support zone near $283.
If the price break above $406 without completed any of these two scenarios we may see it move higher directed to our targets of $444 and $570.
Thank you and Good Luck!
If the price break above $406 without completed any of these two scenarios we may see it move higher directed to our targets of $444 and $570.
Thank you and Good Luck!
✅MY FREE Signals Channel
t.me/TradingPuzzles
✅Personal Telegram
t.me/KlejdiCuni
✅Suggested News Channel
t.me/ForexNewsNavigator_Official
t.me/TradingPuzzles
✅Personal Telegram
t.me/KlejdiCuni
✅Suggested News Channel
t.me/ForexNewsNavigator_Official
Penafian
The information and publications are not meant to be, and do not constitute, financial, investment, trading, or other types of advice or recommendations supplied or endorsed by TradingView. Read more in the Terms of Use.