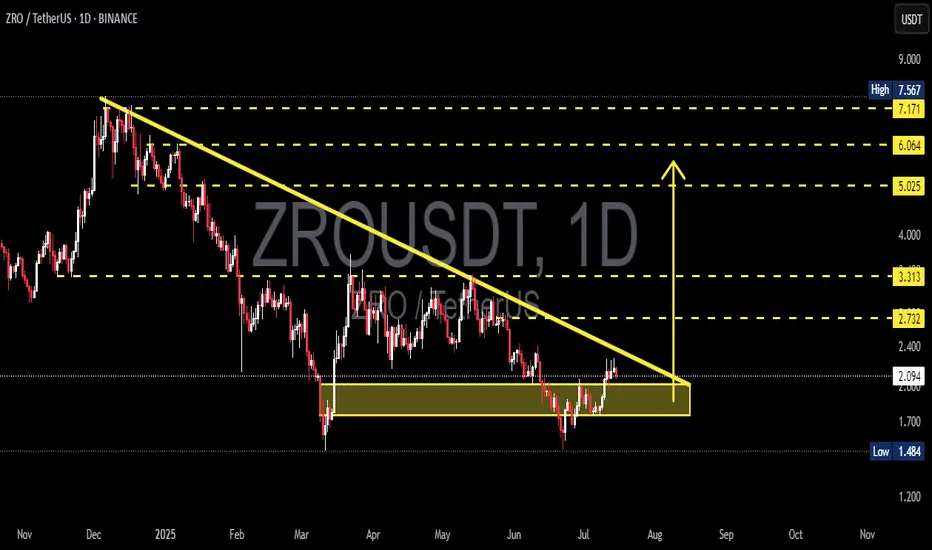
ZRO is currently in a technically significant phase. After months of relentless selling pressure, the price action is now forming a classic Descending Triangle, and price is testing the upper boundary of this structure. A breakout from this zone could trigger a strong bullish reversal with multi-stage targets ahead.
🧩 Pattern Structure & Price Action:
📐 Descending Triangle (Potential Reversal)
Lower Highs have been forming since November 2024.
Strong horizontal support at $1.90 – $2.00, tested multiple times.
Price volatility is compressing, which often precedes a breakout.
This pattern is often considered bearish, but in this extended downtrend context, it can become a bullish reversal pattern if price breaks out to the upside with strong volume.
📊 Key Zones & Target Levels if Breakout Happens:
1. 🔹 $2.30 – Breakout confirmation zone (trendline break).
2. 🔹 $2.73 – Minor resistance from previous structure.
3. 🔹 $3.31 – Strong psychological and historical resistance.
4. 🔹 $5.02 – Primary breakout target based on pattern height.
5. 🔹 $6.06 – $6.50 – Mid-term extension target based on Fibonacci and prior supply zone.
6. 🔹 $7.17 – $7.56 – Extended bullish target in case of strong rally continuation.
🟢 Bullish Scenario:
If price breaks out with a strong daily close above $2.30 accompanied by volume:
Buyers gain control.
Descending triangle becomes a launchpad for upward momentum.
Gradual rally toward $5 and beyond becomes very likely over the next few weeks.
🔴 Bearish Scenario:
If price fails to break the resistance and instead drops below $1.90:
Price could fall toward $1.60 as near-term support.
If bearish pressure continues, price may test the $1.48 support zone (previous local bottom).
Structure remains bearish until significant buying pressure returns.
🧭 Conclusion:
ZRO is at a critical decision point. A clean breakout from this pattern could be the beginning of a major recovery rally. However, failure to break resistance could lead to another leg of consolidation or downside. This is a high-opportunity setup for traders watching for volume and confirmation.
#ZRO #ZROUSDT #CryptoBreakout #TechnicalAnalysis #AltcoinSeason #CryptoTrading #DescendingTriangle #ReversalPattern #ChartAnalysis
✅ Get Free Signals! Join Our Telegram Channel Here: t.me/TheCryptoNuclear
✅ Twitter: twitter.com/crypto_nuclear
✅ Join Bybit : partner.bybit.com/b/nuclearvip
✅ Benefits : Lifetime Trading Fee Discount -50%
✅ Twitter: twitter.com/crypto_nuclear
✅ Join Bybit : partner.bybit.com/b/nuclearvip
✅ Benefits : Lifetime Trading Fee Discount -50%
Penafian
Maklumat dan penerbitan adalah tidak bertujuan, dan tidak membentuk, nasihat atau cadangan kewangan, pelaburan, dagangan atau jenis lain yang diberikan atau disahkan oleh TradingView. Baca lebih dalam Terma Penggunaan.
