BolliTrend Pro + Bands + Supertrend**BolliTrend Pro** is a hybrid trading indicator that combines the strength of Bollinger Bands and Supertrend.
🔹 Supertrend identifies the overall market direction using ATR
🔹 Bollinger Bands dynamically track price volatility and breakout zones
🔹 Together, they highlight trending markets, entry opportunities, and volatility shifts
This tool is suitable for trend-following, breakout, and reversal traders across all markets (Forex, Crypto, Indices).
Built for clarity and precision, BolliTrend Pro offers clean chart visuals for confident decision-making.
For educational use only. Not financial advice.
Penunjuk dan strategi
WaveTrend w/ Crosses & MTFWaveTrend Oscillator from LazeBear, modified to plot crosses and amplified delta.

SNIPERKILLS XXX 1.0 CISD + FVG + OB + SMT Detector"SNIPERKILLS XXX 1.0 – CISD + FVG + OB + SMT Detector"
It’s a multi-component ICT-style trading indicator that detects and displays:
🔹 1. CISD (Candle Impulse Swing Displacement) Breakouts
A form of breakout detection that:
Validates bearish reversal if a large red candle (with body > % threshold) follows a green candle and breaks previous swing high.
Validates bullish reversal if a large green candle follows a red candle and breaks previous swing low.
Optional entry lines are drawn at the breakout level.
🔹 2. FVG (Fair Value Gaps)
Bullish FVG: Detected when the previous two candles' lows are above the current candle's high.
Bearish FVG: Detected when the previous two candles' highs are below the current candle's low.
These are plotted with light-colored squares on the chart.
🔹 3. OB (Order Block) Highlight
Highlights the candle before the CISD displacement candle.
Bullish OB candles are shaded green, bearish are shaded red.
This helps traders spot likely supply/demand zones based on displacement logic.
🔹 4. SMT (Smart Money Technique) Divergence
Compares NQ1! (Nasdaq) and ES1! (S&P 500) to find divergences.
Bullish SMT: NQ makes a lower low but ES doesn’t → Possible long.
Bearish SMT: NQ makes a higher high but ES doesn’t → Possible short.
Plots triangles for SMT divergence.
🔹 5. Stats Table (Optional Display)
Shows real-time counts of:
Total CISD Buy/Sell events
Total FVG Up/Down occurrences
SMT Bullish/Bearish events
Last signal type
User-defined candle body % threshold
🔹 6. Alerts
Fires alerts when CISD, FVG, or SMT signals are triggered.
✅ Customizable Inputs:
Candle body threshold (default 60%)
Swing high/low lookback
Toggle FVG, OB, SMT
Choose table position
🧠 Summary:
This is a powerful, all-in-one ICT-inspired tool designed to help traders spot:
Momentum reversals (CISD)
Institutional gaps (FVG)
Key imbalance zones (OB)
Intermarket divergence (SMT)
with stats and alerts built-in.

VP(Maps)+OB+S&R+GGSHOT+HH BY LEONVCapital Trading System onde é possivel ver high and low, suporte e resistência e orderblocks

Fisher Transform w/ Cross in MTFFisher Transform from Tradingview Technical indicators, modified to hard code settings for various time frames and to plot crosses.

Zone Reversal ProSmart Zones Pro is a multi-functional indicator that identifies key institutional levels using Smart Money Concepts (SMC).
It includes:
🔹 Breaker Blocks – shows strong momentum shift zones
🔹 Order Blocks – highlights potential reversal points
🔹 Overlapping Zones – marks high-confluence areas
🔹 Support/Resistance – auto-detected using pivots
🔹 Buy/Sell Signals – based on moving average crossovers
This tool is ideal for intraday and swing trading.
Clean visuals, optimized zones, and precision-based signals make it a powerful addition to your strategy.
For educational use only. Always test before live trading.

SNIPERKILLS NQ JULY 15 2025,GAMEPLANJULY 15, 2025 GAME PLAN !
Instrument: Nasdaq Futures (NQU2025)
Timeframe Analyzed: 3–5 Minute Chart
Model: SNIPERKILLS-AMD2.0 + IB High/Low + Exp Move + MSS
Bias: Neutral-to-bullish early session, monitoring reactive liquidity zones

ARJUN SPECIAL BUY SELLUSE 2 AND 1 ATR LIMITS WAIT FOR 9 EMA CLOSE //@version=5
indicator('Chandelier Exit with One-Time EMA Confirmation', shorttitle='CE+EMA OneShot', overlay=true)
// === INPUTS ===
length = input.int(title='ATR Period', defval=22, group='Calculation')
mult = input.float(title='ATR Multiplier', step=0.1, defval=3.0, group='Calculation')
useClose = input.bool(title='Use Close Price for Extremums', defval=true, group='Calculation')
showLabels = input.bool(title='Show Buy/Sell Labels', defval=true, group='Visuals')
highlightState = input.bool(title='Highlight State', defval=true, group='Visuals')
awaitBarConfirmation = input.bool(title="Await Bar Confirmation", defval=true, group='Alerts')
// === CHANDELIER EXIT LOGIC ===
atr = mult * ta.atr(length)
longStop = (useClose ? ta.highest(close, length) : ta.highest(length)) - atr
longStopPrev = nz(longStop , longStop)
longStop := close > longStopPrev ? math.max(longStop, longStopPrev) : longStop
shortStop = (useClose ? ta.lowest(close, length) : ta.lowest(length)) + atr
shortStopPrev = nz(shortStop , shortStop)
shortStop := close < shortStopPrev ? math.min(shortStop, shortStopPrev) : shortStop
var int dir = 1
dir := close > shortStopPrev ? 1 : close < longStopPrev ? -1 : dir
buySignal = dir == 1 and dir == -1
sellSignal = dir == -1 and dir == 1
// === EMA LOGIC ===
ema9 = ta.ema(close, 9)
plot(ema9, title='EMA 9', color=color.orange, linewidth=1)
// === STATE TRACKING ===
var bool waitingForStrongBuy = false
var bool waitingForStrongSell = false
var bool strongBuyTriggered = false
var bool strongSellTriggered = false
// Set flags on CE signals
if buySignal
waitingForStrongBuy := true
waitingForStrongSell := false
strongBuyTriggered := false
strongSellTriggered := false
if sellSignal
waitingForStrongSell := true
waitingForStrongBuy := false
strongBuyTriggered := false
strongSellTriggered := false
// Trigger strong signals only once
strongBuy = waitingForStrongBuy and not strongBuyTriggered and close > ema9
strongSell = waitingForStrongSell and not strongSellTriggered and close < ema9
if strongBuy
strongBuyTriggered := true
waitingForStrongBuy := false
if strongSell
strongSellTriggered := true
waitingForStrongSell := false
// === PLOTS ===
plot(dir == 1 ? longStop : na, title='Long Stop', style=plot.style_linebr, linewidth=2, color=color.green)
plot(dir == -1 ? shortStop : na, title='Short Stop', style=plot.style_linebr, linewidth=2, color=color.red)
plotshape(buySignal and showLabels, title='Buy Label', text='Buy', location=location.belowbar, style=shape.labelup, color=color.green, textcolor=color.white)
plotshape(sellSignal and showLabels, title='Sell Label', text='Sell', location=location.abovebar, style=shape.labeldown, color=color.red, textcolor=color.white)
plotshape(strongBuy and showLabels, title='Strong Buy', text='Strong Buy', location=location.belowbar, style=shape.labelup, color=color.lime, textcolor=color.black)
plotshape(strongSell and showLabels, title='Strong Sell', text='Strong Sell', location=location.abovebar, style=shape.labeldown, color=color.maroon, textcolor=color.white)
// === ALERTS ===
await = awaitBarConfirmation ? barstate.isconfirmed : true
alertcondition(buySignal and await, title='Alert: CE Buy', message='Chandelier Exit Buy!')
alertcondition(sellSignal and await, title='Alert: CE Sell', message='Chandelier Exit Sell!')
alertcondition(strongBuy and await, title='Alert: Strong Buy', message='Strong Buy: CE + EMA confirmation!')
alertcondition(strongSell and await, title='Alert: Strong Sell', message='Strong Sell: CE + EMA confirmation!')

CACo Oscillators// Description: An all-in-one momentum indicator designed to complement the main
// "Charles Ayede Convergence" script. It combines the Awesome
// Oscillator (AO) and the OsMA (MACD) into a single pane with a
// display toggle, visual signals, and custom alerts.

CQ_MTF Target Price Lines [BITCOIN HOY]Comprehensive Indicator Script Overview
Intraday, Four Hour, Daily, and Weekly Price Target Lines—A Versatile Tool for Traders
Welcome to a powerful and flexible indicator script designed to enhance your trading experience across multiple timeframes. This script empowers users to interactively set, visualize, and manage price targets, entries, and objectives for both short-term and long-term trading strategies. Whether you are a day trader seeking to mark crucial intraday levels or a long-term investor planning strategic entries, this tool offers an all-encompassing solution.
Key Features
• Multi-Time Frame Price Target Lines: Effortlessly input and display calculated price targets for Intraday, Four Hour, Daily, and Weekly periods, ensuring you always have a clear view of the market objectives at every scale.
• X-Axis Price Control: Set precise x-axis price points for each timeframe, granting you granular control over how and where your target lines appear on the chart.
• Weekly Price Objectives: Enter your calculated price objectives for the current week to remain aligned with your trading plan and adapt to evolving market conditions.
• Long-Term Investment Entry Events: Document and display significant entry events for long-term investments, helping you maintain a strategic perspective while navigating short-term fluctuations.
• Long-Term Price Objectives: Input and track price objectives for your long-term trades, supporting your investment decisions with clearly visualized milestones.
• Customizable Labels and Lines: Each price target is accompanied by clearly labeled lines, making it easy to distinguish between timeframes and targets at a glance.
Optional Price Gauge for Intraday Dynamics
For users who wish to monitor real-time market sentiment, the script includes an optional price gauge. This dynamic feature tracks intraday price movement, providing visual cues to quickly assess whether the prevailing tendency is bullish or bearish. The intuitive gauge aids in confirming your intraday strategies or alerting you to potential reversals.
User Experience and Customization
• Interactive Inputs: All key parameters—price targets, x-axis prices, entry events, and objectives—are entered manually by the user. This approach ensures the script adapts to your personal analysis and trading methodology.
• Easy Visualization: The clear display of lines, labels, and the optional gauge streamlines your chart, making it easier to make informed decisions at a glance.
• Flexible Application: Whether you’re trading short-term swings or building positions for the long haul, the indicator integrates seamlessly into your workflow.
How to Use
• Input your calculated price targets for each timeframe (Intraday, Four Hour, Daily, and Weekly).
• Specify the exact x-axis price points where you’d like the lines to appear for each timeframe.
• For the current week, enter your weekly price objectives for quick reference and planning.
• If you’re a long-term investor, document your key entry events and set long-term price objectives to track their progression.
• To monitor current market momentum, activate the price gauge and follow the visual cues for bullish or bearish trends.
Benefits
• Comprehensive Market Overview: Simultaneously track multiple timeframes and objectives, keeping all critical information at your fingertips.
• Improved Decision Making: Visual clarity and strategic labeling support faster, more confident trading decisions.
• Customizable and Adaptable: Tailor the script to your unique trading style and analytical approach.
Enjoy using the indicator, and happy trading! Let this versatile tool be your companion in navigating the ever-changing tides of the market.

[Momentum Shift Pro – OBx Breaker Reversal System [markking77] 1. Momentum Shift Pro
> Professional Momentum Indicator blending Order Blocks, Breaker Blocks, and Smart Buy/Sell reversal points. Smooth entry logic designed for accurate trend shifts.
✅ Premium OB Zones
✅ Buy/Sell Signal Clarity
✅ Telegram-ready visuals
Developed by @Markking77

Multi-Timeframe Trend Analysis [Aaron Diaz]🧠 Indicator Review: Multi-Timeframe Trend Analysis
📌 What Does It Do?
The "Multi-Timeframe Trend Analysis" indicator by Aaron Diaz performs a trend assessment across multiple timeframes using Exponential Moving Averages (EMAs) as internal logic. Instead of plotting EMAs on the chart, this version only displays a clean dashboard that shows whether each EMA is trending up or down, keeping your chart clutter-free.
🧾 Based on the original indicator by BigBeluga, this version was modified by Aaron Diaz to remove the EMA plots and focus solely on actionable trend information via a table.
🔍 How It Works
It calculates 5 different EMAs (default: 20, 30, 40, 50, 60 periods).
For each EMA, it checks if it’s trending up (EMA > EMA 2 candles ago) or down.
These signals are then evaluated across 5 customizable timeframes (e.g., 1h, 2h, 3h, etc.).
A dashboard/table appears on the top-right corner of your screen, showing:
🢁 = Uptrend for that EMA and timeframe.
🢃 = Downtrend.
It uses color codes (green = bullish, purple = bearish) to make trend reading fast and intuitive.
🧱 Technical Foundations
Exponential Moving Averages (EMAs):
EMAs give more weight to recent prices, making them highly responsive to current trends.
Widely used to detect momentum and reversals.
Multi-Timeframe Analysis (MTF):
Helps confirm trend strength by analyzing multiple timeframes.
Reduces false signals and noise found in a single timeframe.
📈 Suggested Strategy: "MTF Trend Confluence"
🎯 Goal:
Only trade when multiple timeframes confirm the same directional bias.
✅ Long Entry Rules:
At least 3 out of 5 timeframes must show 🢁 on at least 4 of the 5 EMAs.
Confirm entry with:
A bullish candlestick pattern.
A breakout above recent resistance.
Optional filter: RSI or MACD not in overbought zone.
🔻 Short Entry Rules:
At least 3 timeframes must show 🢃 on at least 4 EMAs.
Confirm with:
A bearish candle or breakdown below support.
Optional filter: RSI or MACD not in oversold zone.
🛑 Exit Rules:
Take Profit at key support/resistance levels or at a 2:1 risk-reward ratio.
Stop Loss below/above the last swing or fixed % (e.g., 1.5–2%).
Exit early if the dashboard shows a shift in trend across key timeframes.
🧪 Example Use Case
You're trading on a 15-minute chart:
The dashboard shows 🢁 across 1h, 2h, and 3h timeframes for EMA20, EMA30, and EMA40.
Price breaks a local resistance level.
You enter long and target the next liquidity zone, placing your stop-loss below the most recent swing low.
⚠️ Important Notes
This is not a signal generator—it’s a trend confirmation tool.
Best used for swing or intraday trend trading.
Avoid using it in ranging or sideways markets.

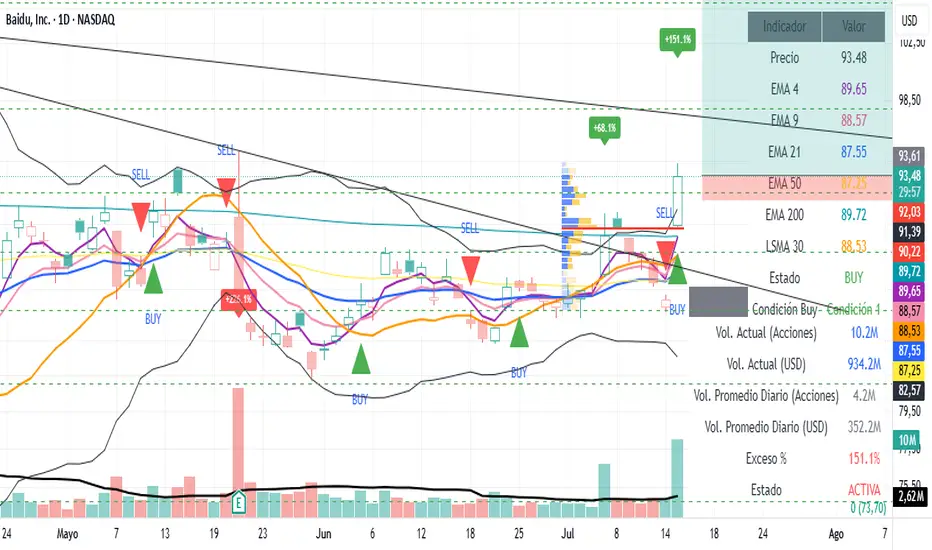
Volume Spike AlertIndicator Features:
📊 Core Functionalities:
Exceptional Volume Detection:
Calculates volume in USD (volume × price)
Compares it against a 90-day average (3 months)
Configurable from 1 to 252 days
Visual Signals:
Green labels for bullish candles with high volume
Red labels for bearish candles with high volume
Displays excess percentage (e.g., +45.2%)
Dual Alert System:
AlertCondition: For manual alert configuration in TradingView
Alert(): Automated alerts with detailed information
⚙️ Available Settings:
Average Period: 1–252 days (default: 90 days)
Enable/Disable Alerts: Configurable checkbox
Show/Hide Labels: Visual control
Label Size: Tiny, Small, Normal, Large
Minimum Threshold: Minimum percentage required to trigger a signal
📋 Displayed Information:
On Labels:
Excess percentage (e.g., +67.3%)
Color based on candle direction
In the Table:
Current volume in millions USD
Average volume in millions USD
Excess percentage
Alert status (ACTIVE/NORMAL)
Calculation period
In Alerts:
Candle type (BULLISH 🟢 / BEARISH 🔴)
Symbol and current price
Current volume vs. average
Timeframe used


1H & 2H Candle Panel + Daily Grid v1.2Indicator: "1H & 2H Candle Panel + Daily Grid v1.2"
This powerful indicator combines two key features into one tool:
Daily Grid anchored to the previous day’s close
Multi-Timeframe Candle Panel for comprehensive market analysis
1. Daily Grid Logic
Input:
Grid Distance (Points): Adjustable spacing between grid lines (default: 5.0 pts).
How It Works:
Detects the start of a new trading day using ta.change(time("D")).
Fetches the prior day’s close via request.security().
Draws the following elements at each new session:
Thick Red Line: Previous day’s closing price (key reference level).
8-Point Grid:
4 blue lines above the close (+1x to +4x the grid distance).
4 gold lines below the close (-1x to -4x the grid distance).
Info Label: Displays the exact prior close value.
Automatically clears and redraws all elements daily to avoid clutter.
2. Multi-Timeframe Candle Panel
Timeframes Analyzed:
Current chart TF, 30M, 1H, 2H, 3H, 4H, 6H, 12H, and Daily (1D).
Data Displayed per TF:
Open, Close, High, Low
Price Difference (Close − Open)
Candle Type (Bullish/Bearish)
Time remaining until candle close (hh:mm:ss format)
Visual Output:
A right-aligned table with conditional coloring:
Bullish candles: Green background
Bearish candles: Red background
Current timeframe highlighted in purple.
Optimized Updates:
Uses request.security() for efficient cross-TF data fetching.
Tracks candle closing times via TradingView’s native time_close.
Updates only on the last bar or in real-time (barstate.islast/isrealtime).
3. Confluence Signals
Full Confluence:
Triggers when all timeframes align:
Buy Signal: All candles bullish → Green arrow + alert.
Sell Signal: All candles bearish → Red arrow + alert.
1H Special Confluence:
Activates 30 minutes after the 1H candle opens.
Requires alignment between 1H, 4H, and 6H candles.
Marks entries with price-level arrows (no alerts).
4. Technical Optimizations
Performance:
Dynamically manages graphic objects (no redundant redrawing).
Uses arrays to track grid lines efficiently.
Precision:
Leverages TradingView’s time_close for accurate countdowns.
Formats prices with format.mintick for asset-specific precision.
How to Use
Adjust Grid Distance based on asset volatility.
Monitor the panel for multi-TF trend strength.
Use the daily grid as support/resistance reference.
Confluence signals highlight high-probability setups.
Pro Tip: Combine with volume analysis or RSI for confirmation!


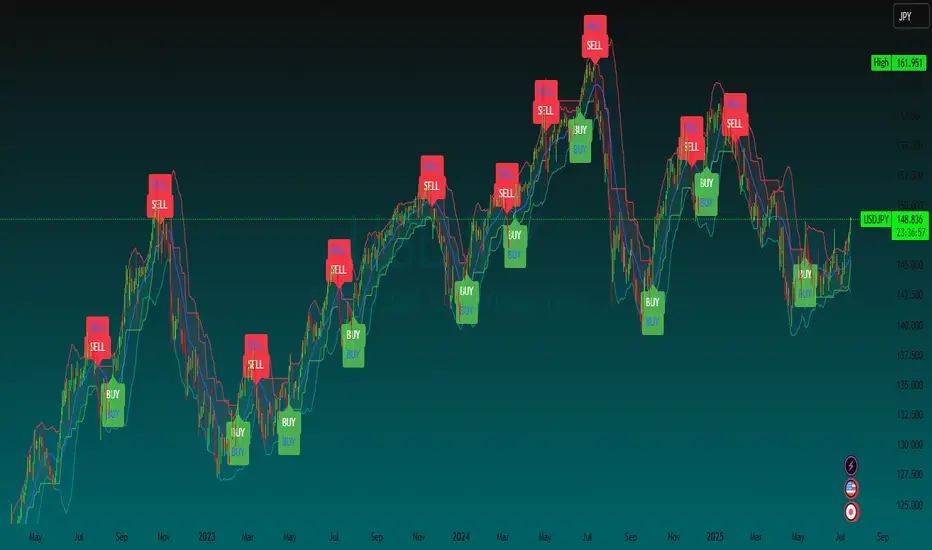
顶底力量这个"顶底力量"指标是一个反转信号识别器,专门用来捕捉价格的顶部和底部转折点。
顶部信号(红色下三角):
价格创新高但动量衰竭
适合考虑做空或止盈多单
底部信号(绿色上三角):
价格创新低但动能衰竭
适合考虑做多或止盈空单
优缺点
优点:
结合价格行为和动量指标,相对可靠
有确认机制,减少假信号
专门捕捉转折点,适合波段交易
缺点:
在强趋势中容易产生假信号
RSI可能长时间保持极值状态
确认周期短,可能错过最佳入场点
Application Scenarios
This is a typical reversal trading indicator:
Top Signal (Red down triangle):
Price makes new high but momentum is exhausted
Consider short entry or take profit on long positions
Bottom Signal (Green up triangle):
Price makes new low but selling pressure is exhausted
Consider long entry or take profit on short positions
Pros and Cons
Advantages:
Combines price action with momentum indicator for reliability
Has confirmation mechanism to reduce false signals
Specifically targets turning points, suitable for swing trading
Disadvantages:
May generate false signals in strong trending markets
RSI can remain at extreme levels for extended periods
Short confirmation period might miss optimal entry points
This indicator is particularly effective in sideways markets or at trend exhaustion points for timing reversal entries.

Z-Score Volume with CVD Clustering Script Title:
Z-Score Volume with CVD Clustering & NY VWAP
📘 Description:
This indicator combines statistical volume analysis with order flow confirmation to detect high-probability trade zones and volume-based divergences.
📌 Components:
Z-Score of Volume: Identifies statistically significant volume surges or drops relative to a moving average baseline.
Cumulative Volume Delta (CVD): Gauges net buying vs. selling pressure using high-frequency bid/ask delta.
K-Means Clustering: Applies clustering logic to classify each bar into:
Cluster 2 – Strong Bullish: Z-Score and CVD both strong
Cluster 1 – Divergence / Bull Trap: Z-Score high, but weak CVD
Cluster 0 – Neutral / Noise: No clear alignment
Anchored VWAP (NY Session Open): Confirms market structure and institutional trend bias from 9:30 AM ET forward.
🎯 Suggested Applications:
✅ 1. Trend Continuation Entries (Add-ons):
Look to add to positions when:
Cluster 2 signal occurs
Price is above the NY session VWAP
Price structure has broken out of prior day high/low or range
⚠️ 2. Divergence Detection (Fade Traps):
Cluster 1 signals a bearish divergence (e.g., high volume but weak CVD).
Especially useful when price is failing to stay above VWAP.
Useful for early exits or reversal setups.
📊 3. Volume Profile Confirmation:
Combine with fixed or session-based volume profile tools.
Use Z-Score clusters to confirm volume spikes into low-volume nodes (LVNs) or during imbalance transitions.
📍 4. VWAP Structure Confirmation:
Anchored VWAP acts as a dynamic reference point.
Helps confirm acceptance vs. rejection zones at key institutional levels.
📈 Visuals & Alerts:
Color-coded volume bars show intensity of Z-Score & CVD confluence
CVD Line plots real-time delta bias with green/red coloring
Cluster-based shape markers highlight key bars for actionable signals
Optional: Add alerts for Cluster 2 above VWAP or Cluster 1 below VWAP
⚙️ Customization Options:
Adjustable Z-Score length
Custom anchor timeframe for CVD (e.g., 1D or sessions)
Adjustable max lookback depth
Toggle VWAP inclusion
Extendable to include additional filters: RSI, structure break alerts, etc.
🔧 Ideal Use Cases:
NY session intraday traders (ES, NQ, CL, 6E, FX pairs)
Breakout traders wanting order flow confirmation
Mean reversion traders spotting fake moves
Volume-based scalpers looking for edge on short-term order imbalance

MTF Confirmation v2Multi-Timeframe Direction Confirmation Indicator
📊 Overview
This Pine Script indicator provides high-probability buy and sell signals by confirming that both 1-minute and 5-minute timeframes are moving in the same direction. It eliminates false signals by requiring multiple timeframe agreement before generating alerts.
🎯 How It Works
Trend Detection Method:
EMA Analysis: Uses 20-period Exponential Moving Average to determine trend direction
RSI Confirmation: 14-period RSI validates momentum (>50 bullish, <50 bearish)
Price Action: Confirms price is above/below EMA in trend direction
EMA Slope: Ensures EMA is actually rising (bullish) or falling (bearish)
Signal Generation:
BUY Signal: Only when BOTH 1M and 5M timeframes are bullish simultaneously
SELL Signal: Only when BOTH 1M and 5M timeframes are bearish simultaneously
Cooldown System: Prevents signal spam with 5-bar minimum between signals
📈 Visual Elements
Primary Signals:
Green "BUY" Labels: Appear below candles when both timeframes align bullish
Red "SELL" Labels: Appear above candles when both timeframes align bearish
Background Colors:
Light Green: Both timeframes trending up
Light Red: Both timeframes trending down
No Color: Timeframes not aligned or neutral
Trend Indicators:
Blue Dots: Show 1-minute timeframe trend direction
Orange Dots: Show 5-minute timeframe trend direction
Question Marks: Partial alignment (one timeframe trending, preparing for signal)
Status Table (Top Right):
Timeframe Status: Real-time direction of each timeframe
Alignment Status: Shows when timeframes are synchronized
Signal Status: Current signal state and cooldown timers
Cooldown Counters: Bars remaining until next signal available
⚙️ Customizable Settings
Technical Parameters:
EMA Period: Default 20 (trend smoothness)
RSI Period: Default 14 (momentum sensitivity)
Signal Cooldown: Default 5 bars (prevents overtrading)
Filter Options:
Volume Filter: Optional above-average volume requirement
Alerts Toggle: Enable/disable notifications
Table Display: Show/hide status information
🚨 Alert System
Instant Notifications: Alerts fire when both timeframes align
Price Information: Includes current price in alert message
Once Per Bar: Prevents alert spam during volatile periods
Clear Messages: "BUY SIGNAL: 1M and 5M both BULLISH" format
💡 Best Use Cases
Ideal For:
Scalping: Quick entries with multi-timeframe confirmation
Day Trading: Reliable intraday signals
Trend Following: Catching strong directional moves
Risk Management: Avoiding false breakouts
Timeframe Recommendations:
Works on any chart timeframe
Most effective on 1M, 5M, or 15M charts
Provides earlier signals than single-timeframe indicators
⚡ Key Advantages
Reduced False Signals:
Requires agreement between multiple timeframes
Filters out noise and whipsaws
Cooldown prevents overtrading
Clear Decision Making:
Simple buy/sell signals
Visual confirmation through colors and table
No complex interpretation required
Comprehensive Information:
Real-time status of all timeframes
Setup warnings with question marks
Countdown to next available signal
📋 Setup Instructions
Copy the Pine Script code
Open TradingView Pine Editor
Paste code and save
Add to chart
Configure settings to preference
Set up alerts for desired signals
🎪 Expected Performance
Signal Frequency: 3-8 signals per trading day (depending on volatility)
Quality Focus: Fewer but higher-probability setups
Win Rate: Improved due to multi-timeframe confirmation
Suitable for: Both automated and manual trading strategies
