Potential reversal likely not only in Bank Nifty but also in these 3 stocks, says Harmonic patterns
The market is undeniably under the grip of bearish sentiment. Fear is at an all-time high as February closed with a significant loss of 6.2% for the Nifty50, marking its fifth consecutive month in the red. In these turbulent times, where uncertainty reigns, and panic spreads, it’s easy to get caught in the wave of pessimism. But, as legendary investor Warren Buffet wisely said, “Be fearful when others are greedy and greedy when others are fearful.”
While the sentiment may be grim, the sharp downturn in the market could also offer opportunities. In such times of heightened fear, keen-eyed traders may discover hidden potential. A closer look at the banking sector reveals harmonic patterns that suggest a possible shift in momentum. These patterns, though rare, can signal potential reversal, often when the market is at its lowest.
What are Harmonic Patterns?
Harmonic patterns rely on specific price structures and Fibonacci ratios to predict future price movements. These patterns help identify potential reversal points in the market. They are built on Fibonacci retracements and extensions, forming clear formations indicating where prices will likely change direction.
The current bearish market may be the backdrop for these bullish patterns to unfold, especially within the banking sector. With such patterns showing up on the charts for the Bank Nifty and prominent banking stocks, a bullish reversal could be on the horizon.
Bank Nifty
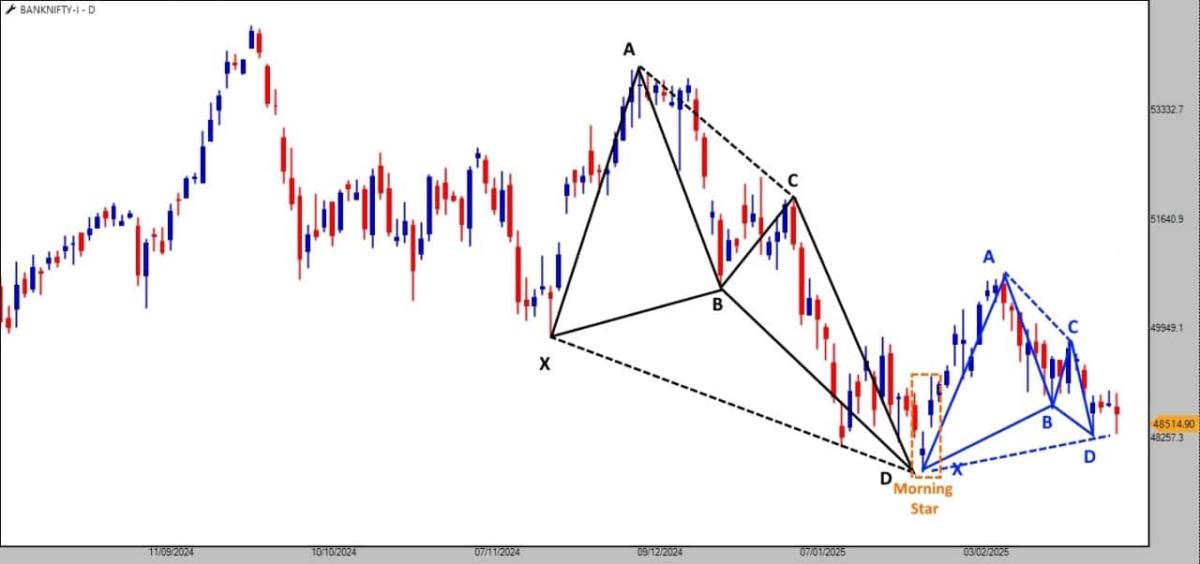
The daily chart of Bank Nifty Continuous Futures shows multiple bullish harmonic patterns, such as the Bullish Butterfly and Bullish Gartley. These patterns, often considered bullish reversal indicators, suggest that the Bank Nifty may soon experience a turn in direction. Additionally, after the Bullish Butterfly pattern, the Morning Star candlestick pattern appears, which is typically a strong indicator of a reversal in sentiment.
As long as the key support level of 47,500 remains intact, the bulls could potentially make their comeback, potentially driving the index higher. Of course, the risk is there, as the patterns are reversal in nature and involve taking a stance contrary to the prevailing sentiment, but the reward could be substantial.
HDFC Bank
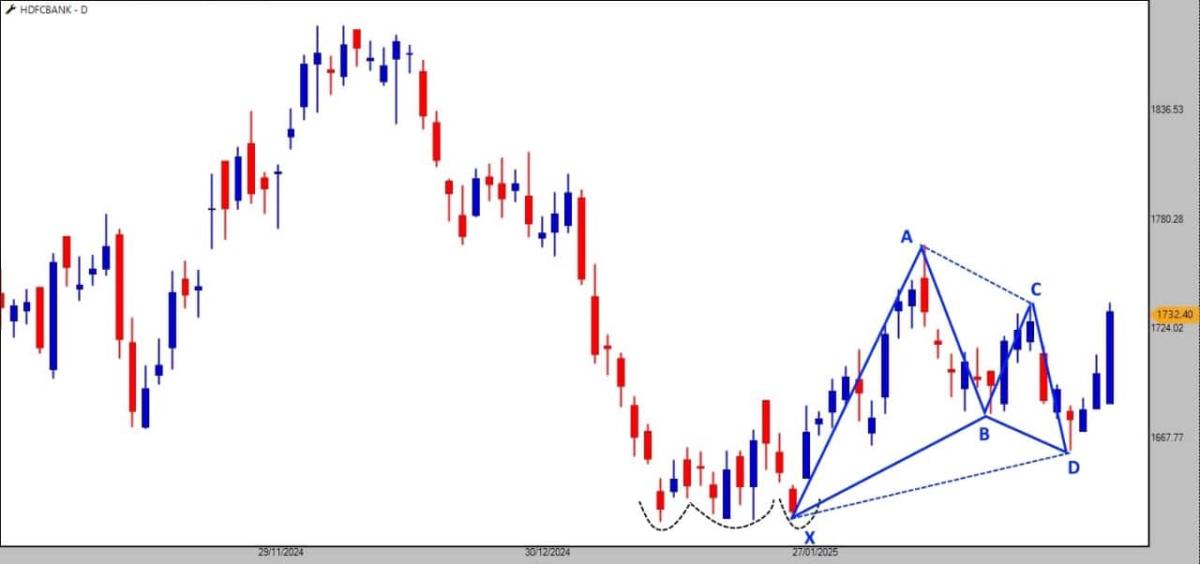
HDFC Bank, a consistent outperformer in the banking space, has been creating ripples of hope for bullish traders. The stock is forming a Bullish Gartley harmonic pattern on the chart, indicating the possibility of a trend reversal.
The most recent low of Rs 1,661 has formed a higher low, a clear signal that the stock is showing resilience and could be positioning itself for a recovery. With the stock having previously formed a triple bottom in January and a higher low in February, HDFC Bank’s chart suggests that it could potentially reverse its downward trend, taking the broader market higher in the process.
ICICI Bank
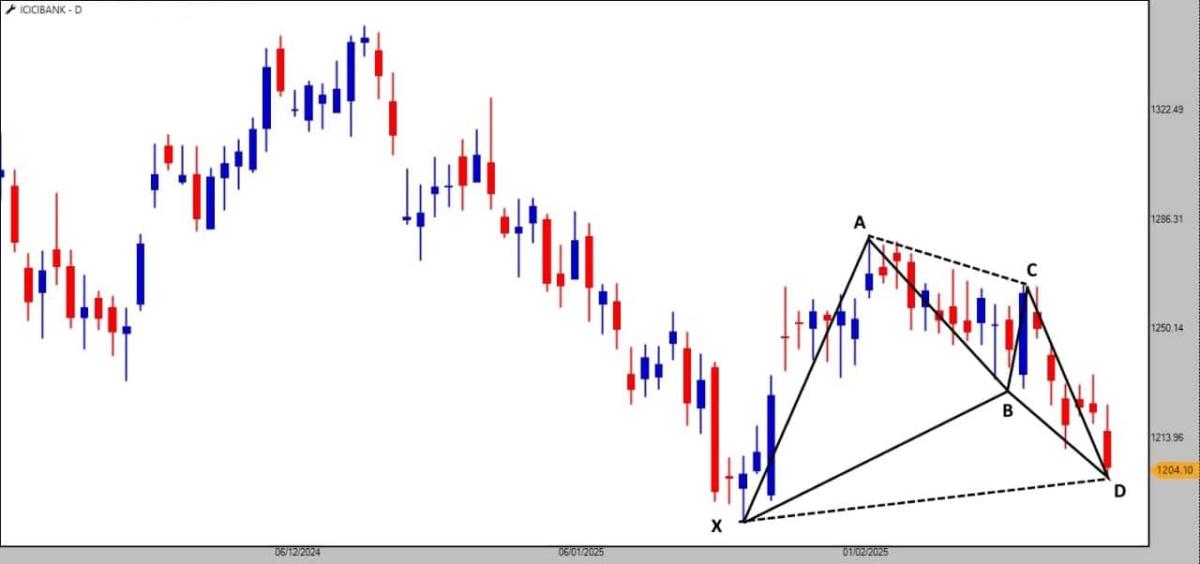
ICICI Bank, one of the largest private sector banks, also shows a Bullish Bat harmonic pattern on its chart. This pattern often signals a potential reversal of the current downtrend as prices approach key support levels. Given that the Bat pattern is well-aligned with the overall Bank Nifty trend, there could be a potential recovery in store for ICICI Bank. If the market sentiment shifts, the reversal could offer substantial gains for those looking to enter the stock at these low levels.
Axis Bank
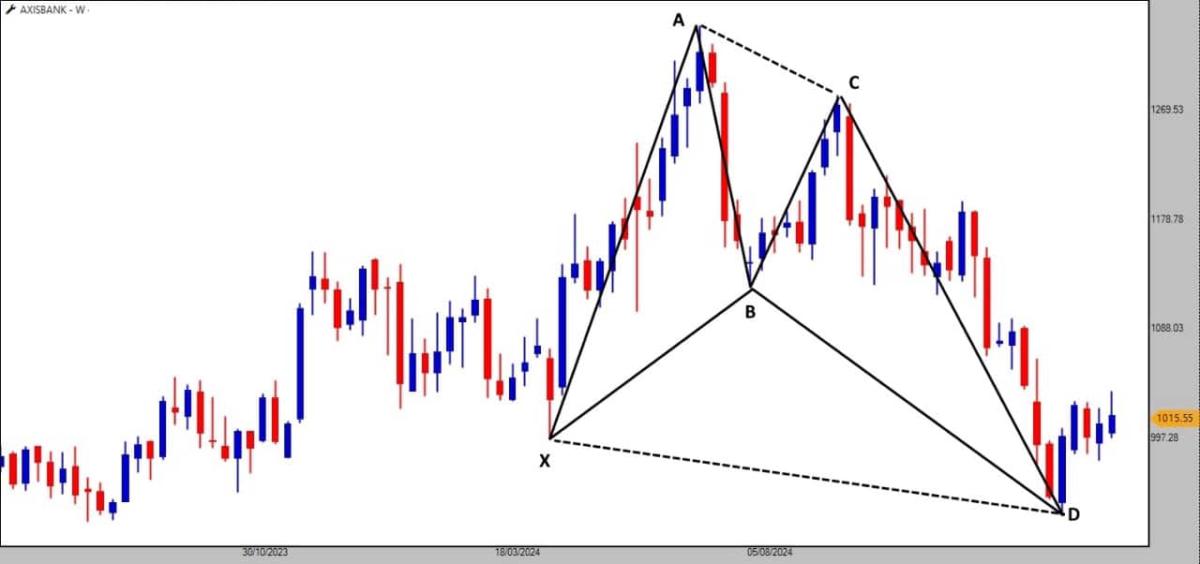
Axis Bank, a key player in the private banking sector, is displaying a Bullish Anti-Shark pattern on the weekly chart. This rare pattern, when confirmed, could lead to a potential reversal in the stock's price action. Furthermore, Axis Bank has already begun outperforming both the Nifty50 and Bank Nifty, suggesting that its strength may continue to grow as the broader market begins to stabilise. This could present an excellent opportunity for traders willing to take on some risk with a promising upside.
The Risks: Reversal Patterns Are Not Without Danger
Harmonic patterns are considered high-risk trades because they go against the grain of prevailing market sentiment. In times of intense fear, as we see now, it’s easy to be cautious, but these patterns often represent the final stages of a downtrend before a reversal. That said, risk management is crucial, and traders should be prepared to exit if the patterns fail.
The key support level for the Bank Nifty is 47,500. If this level is breached, it could negate the bullish reversal setup. For individual stocks, Rs 1,600 for HDFC Bank, Rs 1,145 for ICICI Bank, and Rs 930 for Axis Bank represent critical levels to watch. The patterns would likely be invalidated should these levels be breached, and the bearish trend could continue.
In the current market, when fear is at its peak, it could be the perfect time to be greedy—especially if you are armed with the knowledge of harmonic patterns and the patience to let them unfold.
Note: The purpose of this article is only to share interesting charts, data points and thought-provoking opinions. It is NOT a recommendation. This article is strictly for educative purposes only.Disclaimer: The views and investment tips expressed by investment experts on Moneycontrol.com are their own and not those of the website or its management. Moneycontrol.com advises users to check with certified experts before taking any investment decisions.