OPEN-SOURCE SCRIPT
Cybernetic Sine Wave
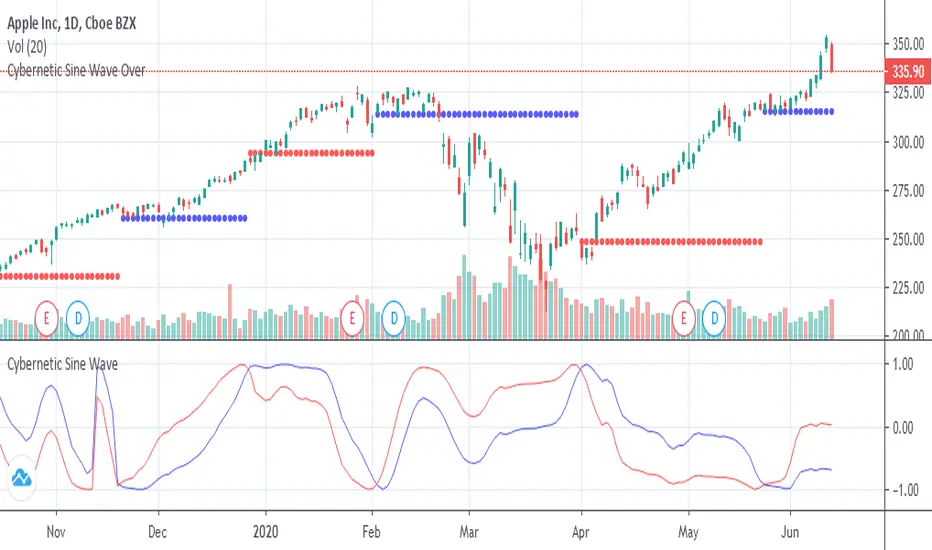
This is John F. Ehlers "Sine Wave Indicator" on the book "Cybernetic Analysis for Stocks and Futures".
When red crosses under blue there is a resistance and the price should fall and when red crosses over blue there is a support and the price should rise, but, the market is always right,
if instead of turning down on the resistance it surpasses it there is a trend up, if instead of turning up on the the support it falls through it there is a trend down.
Skrip sumber terbuka
Dalam semangat TradingView sebenar, pencipta skrip ini telah menjadikannya sumber terbuka, jadi pedagang boleh menilai dan mengesahkan kefungsiannya. Terima kasih kepada penulis! Walaupuan anda boleh menggunakan secara percuma, ingat bahawa penerbitan semula kod ini tertakluk kepada Peraturan Dalaman.
Penafian
Maklumat dan penerbitan adalah tidak bertujuan, dan tidak membentuk, nasihat atau cadangan kewangan, pelaburan, dagangan atau jenis lain yang diberikan atau disahkan oleh TradingView. Baca lebih dalam Terma Penggunaan.