LBB + RSI Multi-Level + Compact TableBB and RSI scalping script for daily or scalp zone with signals
Pengayun

Momentum-Reversal System Signals Pro
Momentum-Reversal System Signals Pro
Overview
A sophisticated signaling system designed to identify high-probability trend-following entries after a price pullback. This indicator is optimized for index futures like the S&P 500 (ES/SPX) on a 5-minute timeframe .
It performs best during periods of established trends and lower volatility. To aid in this, the indicator includes a customizable "No-Trade Zone" highlighter, which is pre-set to the often volatile 8:30 AM - 11:30 AM EST market open. While the default settings are robust and effective in most conditions, the indicator is fully customizable to suit your specific trading style.
How It Works
The core logic is based on a three-step process to filter for high-quality setups:
Trend Confirmation: The script first establishes the overall market direction using an EMA on a higher timeframe (15-minute by default). This ensures you are only looking for trades that align with the dominant trend.
Pullback Detection: Once the trend is confirmed, the script waits for the price to pull back to a dynamic area of value on the main chart (5-minute by default). This "pullback zone" is defined by the 5m EMA and an ATR-based channel around it, which adapts to current market volatility.
Momentum Entry: After a valid pullback occurs, the script waits for a clear sign that momentum is returning in the direction of the primary trend. This is confirmed by a combination of a MACD crossover and a strong RSI reading, signaling that the pullback has likely ended and the trend is ready to resume.
Advanced Quality Filters
What makes this indicator powerful is its multi-layered filtering system designed to weed out low-probability signals and avoid choppy market conditions.
Trend Strength: It doesn't just check the trend direction; it measures the slope of the 15m EMA to ensure the trend has sufficient strength. This is a key filter for avoiding flat, sideways markets.
Momentum Confirmation: An RSI "Dead Zone" around the 50-level ensures that the RSI shows decisive momentum before a signal is generated.
Signal Cooldown: A built-in timer ( Min Bars Between Signals ) prevents the same signal from firing repeatedly in a short period, reducing noise and over-trading.
RSI Volatility: The script checks that the RSI itself is not flat, which is often a sign of market indecision and a precursor to chop.
Pullback Quality: An optional filter ensures that by the time the signal fires, the price has already moved back to the "correct" side of the 5m EMA, confirming the reversal's strength.
Volatility Filter: A crucial risk management filter that blocks signals on abnormally large, high-risk "gasoline" bars that could lead to immediate stops.
How To Use
For Long Signals (Green 'Long' Tag):
Look for the 15m EMA to be green and trending upwards.
Wait for price to pull back towards the orange 5m EMA.
A "Long" signal appears when momentum indicators confirm a reversal back in the direction of the trend.
For Short Signals (Red 'Short' Tag):
Look for the 15m EMA to be red and trending downwards.
Wait for price to pull back towards the orange 5m EMA.
A "Short" signal appears when momentum indicators confirm a reversal back in the direction of the trend.
This tool provides high-probability signals, not guarantees. It is designed to be a core component of a complete trading plan. Always use proper risk management and confluence from your own analysis.
Fine-Tuning & Customization
All settings are fully adjustable in the script's "Inputs" tab to match your risk tolerance and market conditions.
Timeframe & EMA Settings: Adjust the core moving averages that define the trend and pullback zones.
Pullback Settings: Define what constitutes a valid pullback by adjusting the lookback period and the size of the ATR-based "near" zone.
Quality Filters: This is the most important section for tailoring the script's strictness. Increase the EMA Slope, RSI Dead Zone, or Signal Cooldown to receive fewer but potentially higher-quality signals.
Advanced Filters: Enable or disable the Pullback Quality and Volatility filters for an extra layer of confirmation or risk management.
No-Trade Zone Highlighter: Adjust the session and timezone to highlight periods you wish to avoid, such as news events or low-liquidity hours.
Happy trading, and please use this tool responsibly.

Apex Edge - RSI Trend LinesThe Apex Edge - RSI Trend Lines indicator is a precision tool that automatically draws real-time trendlines on the RSI oscillator using confirmed pivot highs and lows. These dynamic trendlines track RSI structure in motion, helping you anticipate breakout zones, reversals, and hidden divergences.
Every time a new pivot forms, the indicator automatically re-draws the RSI trendline between the two most recent pivots — giving you an always-current view of momentum structure. You’ll instantly see when RSI begins compressing or expanding, long before price reacts.
Key Features: • Dynamic RSI trendlines drawn from the last 2 pivots
• Auto re-draws in real-time as new pivots form
• Optional "Full Extend" or "Pivot Only" modes
• Slope color-coded: green = support, red = resistance
• Built-in dotted RSI levels (30/70 default)
• Alert conditions for RSI trendline breakout signals
• Ideal for spotting divergence, compression, and early SMC confluence
This is not your average RSI — it’s a fully reactive momentum edge overlay designed to give you clarity, structure, and timing from within the oscillator itself. Perfect for traders using Smart Money Concepts, divergence setups, or algorithmic trend tracking.
⚔️ Built for precision. Built for edge. Built for Apex.

RSI with 2-Pole FilterA momentum indicator that tells you if a stock is overbought or oversold.
RSI goes between 0 and 100.
70 = overbought (might fall)
<30 = oversold (might rise)
It often looks jagged or choppy on volatile days.
Think of this filter like a momentum smoother:
It still follows RSI closely,
But it doesn’t react to every little jiggle in price,
Which helps avoid false signals.
it keeps track of:
The current RSI,
The last 2 RSI values (inputs), and
The last 2 outputs (filtered RSIs).
It uses feedback to shape the output based on previous values, making it smoother than a simple moving average.

EMA Curl Strength+EMA Curl Strength+
Description:
This indicator provides a statistically normalized view of EMA slope momentum using Z-score transformation. By evaluating the rate of change of an EMA and comparing it against its historical behavior, the script highlights momentum shifts in a dynamic, adaptive way.
⸻
How It Works:
• Calculates the slope (percentage change) of a chosen EMA.
• Normalizes the slope using Z-score over a custom lookback period.
• Smooths the resulting signal and computes two signal lines for comparison.
• Assigns dynamic colors based on user-defined Z-score thresholds for mild, moderate, and strong momentum in both directions.
⸻
Visual Features:
• Gradient fill between the Z Curl Line and Signal 1 to highlight slope acceleration.
• Histogram showing the difference between the Z Curl Line and its signal.
• Optional signal crossover shapes between configurable pairs (e.g., Z Curl vs. Signal).
• Background highlights when the Z Curl Line exceeds ±2, indicating strong trending behavior.
⸻
Customization:
• Adjustable EMA length, smoothing lengths, signal lengths, histogram smoothing, and Z-score lookback.
• Separate color controls for:
• Z-score strength bands (mild/moderate/strong up/down)
• Histogram bars
• Signal lines
• Background highlight zones
• Crossover shapes
⸻
Use Cases:
• Momentum Confirmation: Confirm strength when Z Curl exceeds ±2 with matching background highlights.
• Trend Entry Timing: Look for trades when Z Curl crosses above or below the 0-line.
• Scalping: Capture quick directional moves when momentum accelerates.
• Trend Following: Use strong Z Curl values to confirm trade direction and filter sideways action.
• Divergence Detection: Spot divergences between price and Z Curl movement to anticipate reversals.

Strategy with DI+/DI-, ADX, RSI, MACD, EMA + Time Stop [EXP. 1]Strategy Overview
This is an experimental trend-following strategy combining directional movement indicators, momentum filters, and time-based exits. Built for low timeframes like BTCUSDT 5m, it aims to detect clean directional setups while managing risk tightly.
Indicator Components
• DI+/DI- + ADX – Confirms trend direction and strength
• RSI (14) – Momentum filter (entries only if RSI > 55 or < 45)
• MACD Histogram – Confirms momentum shift in signal direction
• Candle Body % Filter – Screens for strong price commitment bars
• EMA 600 & EMA 2400 – Defines long-term trend alignment
• Time-Based Stop – Closes trade if it doesn’t move 0.75% in 85 bars
• Reward:Risk – 1% stop-loss, 7.5:1 reward-to-risk
• One Trade per EMA Cross – Only trades first valid signal per trend shift
Entry Logic
Long Entry:
• DI+ crosses above DI−
• RSI > 55
• MACD histogram > 0
• Strong bullish candle
• EMA600 > EMA2400
• Occurs within 25 bars of an EMA crossover
Short Entry:
• DI+ crosses below DI−
• RSI < 45
• MACD histogram < 0
• Strong bearish candle
• EMA2400 > EMA600
• Occurs within 25 bars of an EMA crossover
Exit Logic
• Stop-loss: 1% from entry
• Take-profit: 7.5x risk
• Time-stop: Trade closed if price doesn’t move 0.75% in 85 bars
Testing Parameters
• Initial Capital: $10,000
• Commission: 0.04% per trade
• Timeframe: 5-minute
• Tested on: BTCUSDT
• ⚠️ Early-stage strategy — trade count may be low depending on market context. This is shared for educational use and community feedback.
Notes
• This script is experimental and educational
• Please forward-test in a demo environment before using it live
• Open-source for learning and improvement — contributions welcome!

EMA Slope AngleTo help you find out how good is the current trend.If its positive look for longs and vise versa

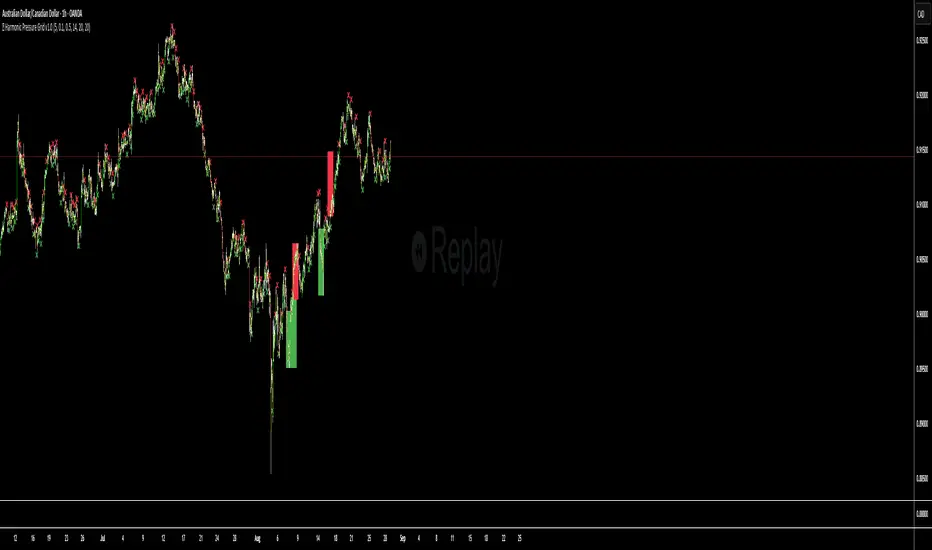
🧭 Harmonic Pressure Grid v1.0Purpose:
The Harmonic Pressure Grid helps traders visually identify hidden pressure zones formed by harmonic swing ratios, filtered through RSI momentum and volume surges. These zones often act as powerful support or resistance levels, marking areas of potential price exhaustion or reversal.
🧩 Core Features:
✅ Automatic Swing Detection – Uses pivot highs/lows to map market structure
✅ Harmonic Ratio Matching – Highlights areas where price swings match common harmonic ratios (0.618, 1.0, 1.272, 1.618)
✅ RSI Slope Filter – Confirms upward or downward momentum during pressure formation
✅ Volume Spike Confluence – Validates the strength of pressure using abnormal volume
✅ Background Pressure Zones – Color intensity reflects confluence strength (green for potential support, red for resistance)
📈 How to Use:
Look for green or red background zones on the chart.
Green = Bullish pressure (potential support)
Red = Bearish pressure (potential resistance)
Zone strength is based on RSI direction + volume spike.
Stronger zones = more likely to influence price
Use zones for:
Entry timing: Watch for reversal behavior or confirmation candles inside zones
Exit planning: Use as target areas for partial or full take profit
Confluence stacking: Combine with trendlines, Fibonacci, or your own price action logic
🔍 Tips:
Works best in swing or positional setups, not scalping
Can be combined with other indicators for added confirmation
Use on any timeframe to reveal hidden structural pressure
Tweak swing length or ratio tolerance for more or fewer zones
TeeLek-BestPositionThis indicator is used to indicate the best buying and selling points.
This indicator will calculate the best buying points (blue) and selling points (orange). The working principle is that the blue point is the point where the RSI is Over Sold, the orange point is the point where the RSI is Over Bought. After that, we will use the Highest Line 100 and Lowest Line 100 to filter the points another layer. And because when Over Bought/Over Sold occurs, there will be continuous signals that are repeated, causing confusion. Therefore, there is a feature to leave a time frame. Set the default value to 24 hours. If a signal occurs, it will be left out.
The appropriate point for buying is:
The point where Over Sold occurs and Closes lower than the Lowest Line 100.
Leave a time frame for 24 hours before a new signal occurs.
The appropriate point for selling is:
The point where Over Bought occurs and Closes higher than the Highest Line 100.
Leave a time frame for 24 hours before a new signal occurs.
It helps us to gradually buy and collect/sell for profit easily without confusion.
อินดิเคเตอร์นี้ใช้ สำหรับบอกจุดซื้อจุดขายที่ดีที่สุด
อินดิเคเตอร์นี้ จะคำนวณจุดซื้อ (สีฟ้า) และจุดขาย (สีส้ม) ที่ดีที่สุดมาให้ โดยหลักการทำงาน คือ จุดสีฟ้า คือจุดที่ RSI Over Sold จุดสีส้ม คือจุดที่ RSI Over Bought หลังจากนั้นเราจะใช้เส้น Highest Line 100 และ Lowest Line 100 เพื่อกรองจุดอีกชั้นหนึ่ง และเนื่องจากเมื่อเกิด Over Bought/Over Sold แล้ว มันจะเกิดสัญญาณต่อเนื่องซ้ำๆ ทำให้สับสน จึงได้มีฟีเจอร์ในการเว้นระยะเวลา ตั้งค่าไว้เริ่มต้นที่ 24 ชั่วโมง ถ้าเกิดสัญญาณแล้วก็จะเว้นระยะออกไป
จุดที่เหมาะสมกับการซื้อ คือ
จุดที่เกิด Over Sold และ Close ต่ำกว่าเส้น Lowest Line 100
เว้นระยะไป 24 ชั่วโมงจึงจะเกิดสัญญาณใหม่อีกครั้ง
จุดที่เหมาะสมกับการขาย คือ
จุดที่เกิด Over Bought และ Close สูงกว่าเส้น Highest Line 100
เว้นระยะไป 24 ชั่วโมงจึงจะเกิดสัญญาณใหม่อีกครั้ง
ช่วยให้เราสามารถ ทยอยซื้อเก็บสะสม/ทยอยขายทำกำไร ได้ง่ายไม่สับสน

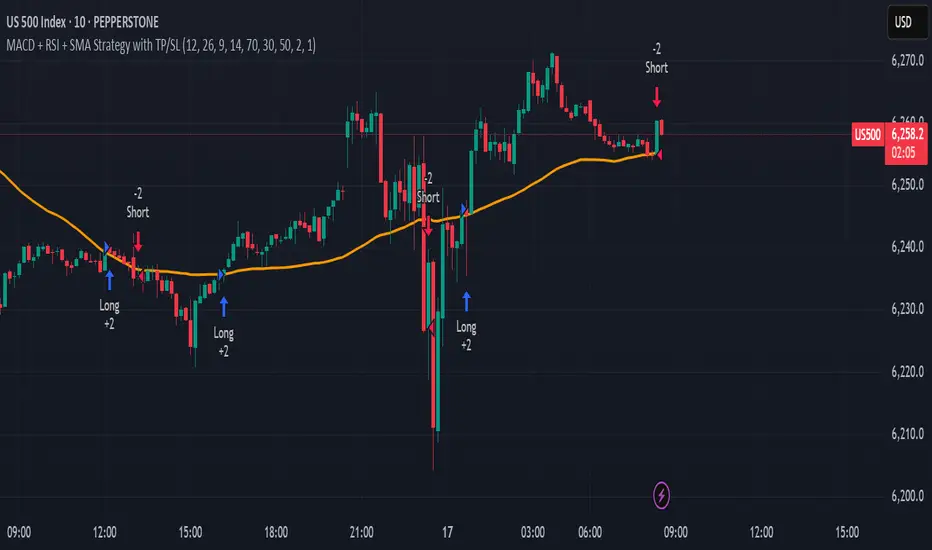
MACD + RSI + SMA Strategy with TP/SLThis strategy combines three technical indicators: MACD, RSI, and Simple Moving Average (SMA) to identify high-probability entry points. It enters trades in the direction of the trend (filtered by SMA), confirms momentum shifts (via MACD crossover), and validates signals with RSI to avoid overbought/oversold conditions.
Key Features:
Directional filter using SMA to align trades with the broader trend.
Momentum validation with MACD crossovers.
Risk control through RSI thresholds and fixed percentage-based Take Profit and Stop Loss levels.
Works for both long and short positions.
Disclaimer: This is a sample strategy for educational purposes only.
Trading involves risk. Use at your own discretion.
You bear full responsibility for any profit or loss.
CVDoogle (CVDoogle Indicator)This is a free simple line indicator that represents Cumulative Volume Delta. The script has been tuned specifically to most popular timeframes to be more accurate of the timeframe of the chart. This may make the line appear less smooth than other indicators, but should be more accurate to the current timeframe of the chart.
This indicator was created to be used along with the following to create a Poor Man's Exochart:
Use Volume Footprint instead of Candles on the TradingView chart
Settings:
Row Size - Auto (ATR)
ATR Length - 9
Display - Cluster
Type - Delta
Add Open Interest Suite - By Leviathan indicator
Timeframes covered by this indicator
15s
30s
1m
2m
3m
5m
6m
10m
12m
15m
24m
30m
45m
1H
2H
3H
4H
5H
6H
8H
12H
1D

Volatility Radar + Classic StochVolatility Radar + Classic Stoch
This indicator detects volatility squeezes by measuring Bollinger Bands tightness relative to recent history and confirms potential breakout strength using multiple factors:
Bollinger Bands bandwidth percentile to identify tight and super-tight squeezes
TTM Squeeze confirmation via Keltner Channels
Volume spikes indicating rising market interest
ADX trend strength to gauge directional momentum
Classic Stochastic oscillator to signal overbought/oversold conditions
A composite volatility score ranks the overall setup strength with intuitive color-coded background and a real-time label.
Use this tool to anticipate volatility expansions and improve timing for breakout trades.

TZanalyserTZanalyser (Trend Zone Monitor With Trend Strength, Volume Focus And -Events Markers)
Before I used TrendZones to manage my portfolio I used Fibonacci Zone Oscillator as my favorite in the sub panel, accompanied with another subpanel indicator which I never published called IncliValue and also REVE Cohorts.
TZanalyser inherits Ideas and code from all three of them: The visual and the idea of using a channel as the basis for an oscillator depicted as a histogram, is taken from the FibZone Oscillator. The idea of providing a number to evaluate the trend is taken from IncliValue. The idea to create a horizontal line which indicates high and low volume focus completed with markers for volume events, is taken from REVE-cohorts.
These ideas are combined in one sleek visual called TZanalyser. TZ stand for TrendZones, because the histogram is based on it.
The histogram.
Depicted is the distance of the price from COG as percent. The distance between Upper Curve and Lower Curve is used as 100%. The values may reach between 300 and -300. The colors indicate in which zone the candle lives, blue in the blue zone, green in the green zone etc. Despite the absence of a gray zone, there are gray bars. These depict candles that wrap around COG. Because hl2 is used as price, some gray bars point up and others down. The orange and red bars point down because the orange and red downtrend zones are below COG.
Use of the histogram.
Sometimes I need to create a list of stocks which are in uptrend in monthly, weekly and daily charts from the stocks I follow in my universe. This job is done fast and easy by looking at the last bar of the histogram. The histogram also gives a quick evaluation of how the stock fared in the past.
The number.
Suppose I need to allocate some money to another stock, selected a few, looked into news and gurus and they look equally good. Then it is nice to be able to find out which has the best charts. Which one has the strongest uptrend. For this purpose this number can be consulted, because it indicates somehow the strength of the trend. It is an integer between 20 and -20, the closer to 20 the stronger the uptrend, closer to -20 indicates a stronger downtrend. The color of the background is the same as the last column of the histogram.
Volume focus and events
The horizontal lines depict volume focus, the line below the focus that comes with the uptrend columns pointing up, the one above the focus for the downtrend columns pointing down. Thes line have tree colors: maroon for high volume focus, green for normal volume and gray for low volume situations. Between the lines and the histogram triangles appear at volume events, a green triangle when the candle comes with high volume, i.e. 120-200 percent of normal, maroon when extreme volume, i.e. more than 200 percent of normal.
The direction of these triangles is that of the histogram, i.e. when the price is higher, direction is up and vice versa.
Take care and have fun.

SMI Panel (kolupaiev)Stochastic Momentum + table trand + alerts
The indicator is composed of STOCHASTIC and MOMENTUM.
A table for tracking the trend on higher timeframes (1D and 1W) has also been added.
Notifications can be configured to follow the trend.

RSI Mansfield +RSI Mansfield+ – Adaptive Relative Strength Indicator with Divergences
Overview
RSI Mansfield+ is an advanced relative strength indicator that compares your instrument’s performance against a configurable benchmark index or asset (e.g., Bitcoin Dominance, S&P 500). It combines Mansfield normalization, adaptive smoothing techniques, and automatic detection of bullish and bearish divergences (regular and hidden), delivering a comprehensive tool for assessing relative strength across any market and timeframe.
Originality and Motivation
Unlike traditional relative strength scripts, this indicator introduces several distinctive improvements:
Mansfield Normalization: Scales the ratio between the asset and the benchmark relative to its moving average, transforming it into a normalized oscillator that fluctuates around zero, making it easier to spot outperformance or underperformance.
Adaptive Smoothing: Automatically selects whether to use EMA or SMA based on the market type (crypto or stocks) and timeframe (intraday, daily, weekly, monthly), avoiding manual configuration and providing more robust results under varying volatility conditions.
Divergence Detection: Identifies four types of divergences in the Mansfield oscillator to help anticipate potential reversal points or trend confirmations.
Multi-Market Support: Offers benchmark selection among major crypto and global stock indices from a single input.
These enhancements make RSI Mansfield+ more practical and powerful than conventional relative strength scripts with static benchmarks or without divergence capabilities.
Core Concepts
Relative Strength (RS): Compares price evolution between your asset and the selected benchmark.
Mansfield Normalization: Measures how much the RS deviates from its historical moving average, expressed as a scaled oscillator.
Divergences: Detects regular and hidden bullish or bearish divergences within the Mansfield oscillator.
Timeframe Adaptation: Dynamically adjusts moving average lengths based on timeframe and market type.
How It Works
Benchmark Selection
Choose among over 10 indices or market domains (BTC Dominance, ETH Dominance, S&P 500, European indices, etc.).
Ratio Calculation
Computes the price-to-benchmark ratio and smooths it with the adaptive moving average.
Normalization and Scaling
Transforms deviations into a Mansfield oscillator centered around zero.
Dynamic Coloring
Green indicates relative outperformance, red signals underperformance.
Divergence Detection
Automatically identifies bullish and bearish (regular and hidden) divergences by comparing oscillator pivots against price pivots.
Baseline Reference
A clear zero line helps interpret relative strength trends.
Usage Guidelines
Benchmark Comparison
Ideal for traders analyzing whether an asset is outperforming or lagging its sector or market.
Divergence Analysis
Helps detect potential reversal or continuation signals in relative strength.
Multi-Timeframe Compatibility
Can be applied to intraday, daily, weekly, or monthly charts.
Interpretation
Oscillator >0 and green: outperforming the benchmark.
Oscillator <0 and red: underperforming.
Bullish divergences: potential relative strength reversal to the upside.
Bearish divergences: possible loss of momentum or reversal to the downside.
Credits
The concept of Mansfield Relative Strength is based on Stan Weinstein’s original work on relative performance analysis. This script was built entirely from scratch in TradingView Pine Script v6, incorporating original logic for adaptive smoothing, normalized scaling, and divergence detection, without reusing any external open-source code.

WaveTrend w/ Crosses & MTFWaveTrend Oscillator from LazeBear, modified to plot crosses and amplified delta.

Fisher Transform w/ Cross in MTFFisher Transform from Tradingview Technical indicators, modified to hard code settings for various time frames and to plot crosses.

RSI + ADX with Custom PeriodsThis script merger RSI and ADX into one indicator.
RSI and ADX has option to customize their individual periods.

Scalp Trading Setup (EMA9/21 + VWAP + Stoch RSI)
On 1-minute, wait for candle confirmation and volume spikes to avoid false signals.
On 5-minute, this setup is most reliable for clean trend scalping (ideal entry alignment).
Use 15-minute for direction bias only, not for entry.

MCC Smart Reversal Signals📊 MCC Smart Reversal Signals (Stoch RSI) v1.0.9
© 2025 Jawid Iqbal Anwar — MIT License
This indicator is designed to help traders detect potential market reversal points by combining multiple confirmation tools such as:
Stochastic RSI
Classic RSI
Trend direction (EMA-based)
Candlestick reversal patterns
Re-entry logic
Dollar-Cost Averaging (DCA) strategy
Built-in alert system
🔄 What’s New in v1.0.9
✅ Time-Frame Presets: Choose from Custom, Weekly, Daily, 4H, 1H, or 15m profiles — each with optimized parameters.
🤖 Auto Mode: The script can automatically detect the chart timeframe and apply the best preset settings.
🎯 Dynamic Overbought/Oversold Levels:
On 15m and 1H, RSI and Stoch RSI use 6 (Oversold) and 94 (Overbought)
On 4H, Daily, and Weekly, it uses 30/70 for RSI and 20/80 for Stoch RSI
🧠 All original logic from v1.0.8 is retained: signal throttling, strong confirmation, and DCA logic.
🔧 How It Works
1. Watch Buy / Watch Sell Signals
These are early signals that notify you of a possible reversal forming.
🟠 Watch Buy: Triggered when the Stoch RSI enters oversold territory. Will only appear if the market isn’t trending strongly downward.
🔵 Watch Sell: Triggered when the Stoch RSI moves into overbought territory. Once fired, it will pause for a few candles unless the zone is exited.
⚠️ OB/OS zones are adjusted based on the selected preset or Auto mode.
2. Strong Reversal Signals (Higher Confidence)
These provide stronger confirmation when all of the following align:
RSI is in an extreme zone (very low or very high)
A reversal candlestick pattern appears (doji, bullish/bearish)
RSI recently changed direction
EMA trend supports the move (not against a strong trend)
When this happens, you’ll see a green (Buy) or red (Sell) label. These are typically high-probability entries.
3. Re-Entry Dots
If the price stays oversold or overbought for a while and forms a new valid candle setup, a new “Watch” dot will appear.
🔁 These help you catch continuation or delayed reversal setups.
4. DCA (Dollar-Cost Averaging) Signals
✅ DCA Buy: RSI is very low and Stoch RSI remains in the oversold zone — a good place to scale into a long position.
❌ DCA Sell: RSI and Stoch RSI are both in the overbought zone — ideal for scaling out or taking profit.
5. Signal Throttling (Smarter Alerts)
To avoid over-signal noise, the script includes throttling logic:
A signal won’t repeat unless the zone is exited and re-entered.
There’s a minimum bar gap between signals to reduce clutter.
🔔 Built-in Alerts (No Setup Needed)
The script includes alerts for all signal types:
Watch Buy / Watch Sell
Strong Buy / Strong Sell
DCA Buy / DCA Sell
Once you add the script to your chart, you can enable alerts immediately.
🕒 How to Use Timeframes
With v1.0.9, the indicator adapts to your chart:
Auto Mode: Just load the indicator — it adjusts based on your active timeframe.
Manual Presets: Choose a preset if you want specific control.
Timeframe Default OB/OS Settings
15m & 1H RSI & Stoch RSI: 6 / 94
4H+ RSI: 30 / 70, Stoch RSI: 20 / 80
🛠️ Suggested Trading Flow
Add the indicator and select a timeframe preset (or use Auto).
Wait for 🟠 Watch Buy or 🔵 Watch Sell — watch the price behavior.
If a 🟢 Strong Buy or 🔴 Strong Sell appears, consider entering with confirmation.
Use ✅ DCA Buy or ⏺️ DCA Sell to scale in/out slowly.
Use EMA trend and candlestick context to refine your decision.
💡 Final Tips
Let signals come to you — don’t force trades.
Use the OB/OS zones and alerts as part of a structured strategy.
Combine this tool with your price action knowledge for best results.

Quad RSI MTFQuad RSI MTF
it's unique, visually rich, and highly useful for traders who want to understand momentum across different time horizons.
Quad RSI MTF is a custom indicator that plots the Relative Strength Index (RSI) from four different timeframes on one chart pane. It’s designed to help traders spot:
Multi-timeframe momentum alignment
Divergences between short-term and long-term RSI
Early warnings of trend reversals or exhaustion
Overbought/Oversold extremes across timeframes
Four RSI Inputs:
Fully customizable lengths and timeframes (e.g., 1H, Daily, Weekly, Monthly).
Uses request.security() to fetch RSI values from higher/lower timeframes.
Color-coded RSI plots:
Easy to visually differentiate between RSI 1–4.
Helps spot alignment or disagreement between timeframes.
Multi-Level Overbought/Oversold Bands:
Level 1: Traditional RSI zones (70/30)
Level 2: Extreme zones (98/2) to catch euphoria or panic
No repainting:
All values are based on historical RSI closes, ensuring reliability.

QQE MOD + QQE WEIGHTED OSCILLATORQQE MOD WITH QQE WEIGHTED OSCILLATOR added to the same subchart pane. fast line crossing slow line is a signal

FInal Signal
This indicator for 4H timeframe by default
RSI + Moving Average of RSI from the 1-hour chart
MACD from the 1-hour chart
21 EMA from the 4-hour chart
5 EMA from the Daily chart
This multi-timeframe fusion offers strength: confirming shorter-term momentum with higher-timeframe support.
✅ Buy Conditions:
RSI is above its moving average → signals bullish momentum
MACD line > MACD signal line → confirms trend shift
RSI has upward slope (compared to 2 candles ago)
❌ Sell Conditions:
RSI falls below its moving average
MACD turns bearish (signal line overtakes)
RSI slopes downward
Price trades below daily EMA → confirms weakening trend
🔊 Volume Spike Detection
I also added a volume condition that checks:
If current volume > 2x the moving average (length = 10)
