OPEN-SOURCE SCRIPT
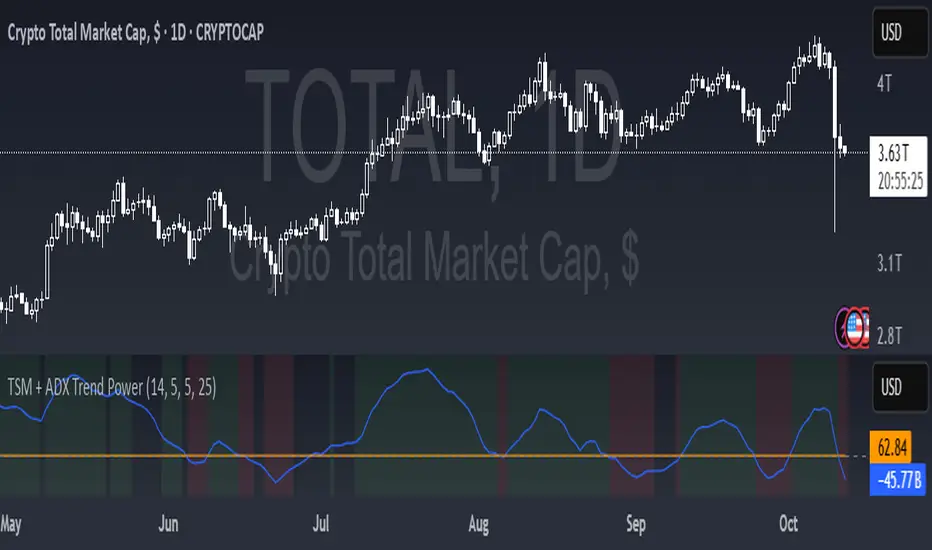
TSM + ADX Trend Power

Logic Behind This Indicator
This indicator combines two momentum/trend tools to identify strong, reliable trends in price movement:
1. TSM (Time Series Momentum)
What it does: Measures the difference between the current price and a smoothed average of past prices.
Formula: EMA(close - EMA(close, 14), 14)
Logic:
If TSM > 0 → Price is above its recent average = upward momentum
If TSM < 0 → Price is below its recent average = downward momentum
2. ADX (Average Directional Index)
What it does: Measures trend strength (not direction).
Logic:
ADX > 25 → Strong trend (either up or down)
ADX < 25 → Weak or no trend (choppy/sideways market)
Combined Logic (TSM + ADX)
The indicator only signals a trend when both conditions are met:
Condition Meaning
Uptrend TSM > 0 AND ADX > 25 → Strong upward momentum
Downtrend TSM < 0 AND ADX > 25 → Strong downward momentum
No signal ADX < 25 → Trend is too weak to trust
What It Aims to Detect
- Strong, sustained trends (not just noise or small moves)
- Filters out weak/choppy markets where momentum indicators often give false signals
- Entry/exit points:
- Green background = Strong uptrend (consider buying/holding)
- Red background = Strong downtrend (consider selling/shorting)
- No color = Weak trend (stay out or wait)
Skrip sumber terbuka
Dalam semangat TradingView sebenar, pencipta skrip ini telah menjadikannya sumber terbuka, jadi pedagang boleh menilai dan mengesahkan kefungsiannya. Terima kasih kepada penulis! Walaupuan anda boleh menggunakan secara percuma, ingat bahawa penerbitan semula kod ini tertakluk kepada Peraturan Dalaman.
Penafian
Maklumat dan penerbitan adalah tidak bertujuan, dan tidak membentuk, nasihat atau cadangan kewangan, pelaburan, dagangan atau jenis lain yang diberikan atau disahkan oleh TradingView. Baca lebih dalam Terma Penggunaan.